How Can We Quantify Power Play Performance In Formation?

Screen Shot 2016-02-26 at 4.55.31 PM

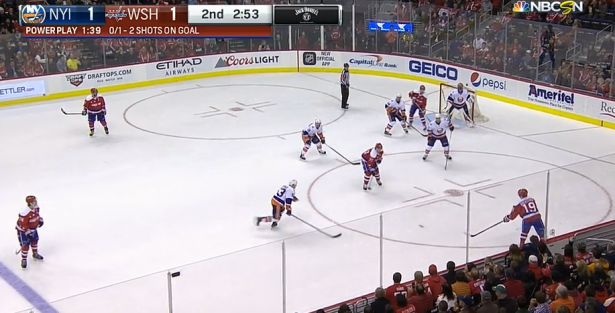
Last week I wrote about a new metric, ZEFR Rate, which measures zone entry success on the power play and is relatively repeatable and predictive of future goal scoring efficiency. The metric was based around the idea that getting into formation efficiently — most frequently a 1-3-1 — is a catalyst for power play success.

But now let’s say you’re a team that has perfected your entry scheme, and you find yourself setting up in formation at a consistent rate. What now? How can one maximize one’s use of possession in formation to score goals at the highest possible rate?

Continue reading

ZEFR Rate: A New and Better Way to Evaluate Power Plays

Screen Shot 2016-04-17 at 4.49.36 PM

Some day we will reach the point where we can comprehensively analyze which power plays are the best, which players drive that success, and most elusively, what roles to place players in to maximize a unit’s output, but statistically, our special teams cupboard is pretty bare. This season, as many of you know, I took on the long and arduous task of hockey tracking in the interest of trying to get us even one step closer to our objective: how can we better evaluate and predict power play success? So let’s dive right in. Continue reading

Blue Jackets Coach Todd Richards’ Firing, & Why the History Doesn’t Agree With Mike Harrington

Photo by user

Photo by user “Arnold C,” via Wikimedia Commons; altered by author

The Columbus Blue Jackets made a bold move today, firing their coach of 3 1/2 seasons Todd Richards in favor of noted firebrand and Brandon Dubinsky fan John Tortorella. The move, riding the coattails of a 0-7 start for the Jackets, was done unusually early in the season, so unusually I decided to spill a little ink on it.

Around the same time I was rounding up the data, the esteemed (Buffalo Baseball Hall of Fame!) Sabres writer and analytics pot-shotter Mike Harrington decided now was the time to defend a decision that made little sense, about a team he doesn’t write about. It started with a reasonable tweet from Friend of the Blog Micah Blake McCurdy:

At which point Harrington followed:

Alright, Mike, let’s take a look at the “numbers that count,” according to you. There’s a fun history here.

Continue reading

Practical Concerns: How I do video

Video is the best teaching tool there is.

Video is the best teaching tool there is.

Preparing and organizing game footage is one of my main responsibilities working for the McGill Martlet hockey team, and has become something that I enjoy quite a bit over the course of the past two seasons. Having played for coaches who use video analysis to various degrees in both hockey and tennis growing up, I think seeing one’s self play sports on video is the best way to correct deficiencies and identify areas for growth.

Continue reading

A Look into Alex Ovechkin’s Elite Power Play Abilities

"Alex Ovechkin2" by Keith Allison. Licensed under Public Domain via Commons.

Alex Ovechkin2” by Keith Allison. Licensed under Public Domain via Commons.

I don’t know if we’ll ever see a power play quite like that of this decade’s Washington Capitals. We can’t attach a firm date to it because it could extend as far as the end of Alex Ovechkin’s career at this rate, but we know that its peak of power began with the hiring of Adam Oates as Caps head coach back in 2012. Oates had run a successful 1-3-1 power play for the New Jersey Devils with Ilya Kovalchuk as his trigger-man, but nothing even close to the heights he managed to achieve with the man advantage in his two seasons in DC. Barry Trotz, to his credit, has kept the same formation — what’s that old adage about things that ain’t broke? — with only minor tweaks, and last year the power play continued to succeed.

Now there’s a lot to discuss about the formation and its success — I like to think of the Caps’ PP as a work of art more than anything else — but for the sake of this post I’m going to focus in on Alex Ovechkin. Never has there been a more criticized future first-ballot Hall of Famer, nor arguably a more controversial elite goal scorer. It should already be a given that Ovechkin is the best power play goal scorer of all time — he sits fifth overall in PPG/g despite playing in a significantly lower scoring era than his contemporaries like Mike Bossy and Mario Lemieux — but I would argue by the time he retires, he will also likely be the greatest goal scorer of all time period. It’s the man advantage recently, in the latter stages of Ovechkin’s goal scoring peak, that has been the sniper’s bread and butter. Since Oates brought the 1-3-1 to town, Ovi has scored 48% of his goals on the power play, compared to 33% prior to that. He scored 25 power play goals last year, six ahead of the next highest total in Joe Pavelski’s 19. You have to go back another five to reach the player who is in third — Claude Giroux with 14 — indicating how great of a season the Sharks’ center/winger had, but that’s a story for another day.

Continue reading

NHL Analytic Teams’ State of the Union

Pure-mathematics-formulæ-blackboard

Fandom means a lot of different things to different people. But one thing unites us all: we hope our favorite team will win, and spend a great deal of time thinking how they can.

For those of us who dig a little deeper on the “how” side and use analytics, we hope that our work will eventually make its way to a front office. In some ways, it already has: numerous “hockey bloggers” hirings have been made recently.

But how many and for which teams?

With some research, I’ve culled a working document on all analytics hires for NHL teams and how they may be using analytics. The following descriptions comes from a variety of sources including Craig Custance’s Great Analytics Rankings [Paywall], fellow bloggers from across the internet, media reports, word of mouth and anonymous insiders.

It should be noted that just because a team has made an “analytics hiring”, it doesn’t necessarily mean that they value their input or use the analysis provided properly. In fact, hires can be made simply for PR reasons, and some teams may even give analytics tasks as secondary duties to staff members who do not posses any formal background in the subject. Teams may also have hired private firms providing proprietary data, which in reality may not provide any tangible, verifiable value than what is free and readily available online.

Continue reading

How Did Bucci Do? Revisiting John Buccigross’s Alex Ovechkin Goals Projection

Photo by

Photo by “Photonerd23” via Wikimedia Commons

In February of the 2009-10 season, John Buccigross of ESPN was spurred by a mailbag question to do a quick thought experiment: does he think Ovechkin could set the all-time goals mark? Gabe Desjardins voiced skepticism of Bucci’s optimistic projection but didn’t offer a counter-projection, presumably because, as he wrote:

Basically, careers are incredibly unpredictable – nobody plays 82 games a year from age 20 to age 40. And players who play at a very high level at a young age tend to not sustain that level of play until they’re 40…So, to answer the reader’s question: I believe that there is presently no significant likelihood that Alex Ovechkin finishes his career with 894 goals. He needs to display an uncommon level of durability for the next decade, and not just lead the league in goal-scoring, but do so by such a wide margin that he scores as much as Gretzky, Hull or Lemieux did in an era with vastly higher offensive levels.

That said, I thought it would be fun, with five full years gone, to see how Bucci did, and try to build a prediction model with the same data he had available. Continue reading

The NHL Systems Argument: Comparing Bruce Boudreau, Alain Vigneault, & Lindy Ruff

Bruce-Alain Ruff. Looks like the ghost of Gene Hackman. You're welcome for the nightmares.  Composite of images by

“Bruce-Alain Ruff. Looks like the ghost of Gene Hackman. You’re welcome for the nightmares.” Composite of images by “DSCF1837” (Vigneault), Michael Miller (Boudreau), and Arnold C. (Ruff), via Wikimedia Commons*

Systems are without question the most elusive, yet most important, part of our understanding of hockey and the application of analytics. What works and what doesn’t? To what degree can a coach or team apply a strategy?

This led me to think about where we might most convincingly see evidence of a system at work. In the past, we here at HG have had a lot of skepticism about a number of elements of a “system.” For example, Garik’s pieces on competition-matching lines (here and here) and the use of the “defensive shell” to protect a lead, neither of which presented themselves as particularly effective ways of looking at or implementing systems. I have shown in the past that attempts to use extreme deployment in terms of zone starts doesn’t move the needle beyond a 60-40 range of possession, the range of shooting shares for forwards and defensemen haven’t seemed to change much over the last 20-25 years, and a plotting of even-strength shots-for with top and bottom possession teams do not suggest a major difference in shot location.

So where to go from there? Eventually, I decided that we need to get to an extreme enough situation, with robust enough data, where a team might have the best opportunity to dictate a system — in other words, we need to look at the powerplay. The most ideal opportunity for comparison, given the workable data for me, comes from the coaching careers since 2008-09 of Bruce Boudreau, Lindy Ruff, and Alain Vigneault. They all provide at least a couple of seasons with different teams, in addition to a robust set of coaching data from 2008 to the present. Let’s see what we can see…

Continue reading

Friday Quick Graphs: Are the 2014-15 Buffalo Sabres the Worst Team of All-Time?

This is part-opportunity to finally explore this question, and part-opportunity to tout some existing and upcoming data visualizations for HG. Travis Yost has been following the absolutely terrible Sabres season all year, and has raised some questions about whether it’s an all-time worst team. He’s only been able to reach back to the admittedly bad early 2000s Atlanta Thrashers, but the historically bad team by which all others need to be measured is the 1974-75 Washington Capitals squad. Using an historical metric like 2pS%, or a team’s share of all on-ice shots-for in the first 2 periods (expressed as a percentage), we can bring the 2014-15 Sabres together with the 74-75 Caps to see where both teams stand. Note: I used the cumulative version of the measure below, and added lines for one standard deviation below league-average in both seasons.

For as bad as Buffalo has been, they haven’t quite matched the futility of the 74-75 Capitals…nor should they. The Capitals were an expansion team that year, and unlike in other years the NHL did not really reach out to ensure the expansion teams in 1974-75 were given a good base to build from. These were also the peak years of the World Hockey Association, which made professional level talent even more diffuse than normal. The other expansion team in 74-75, the Kansas City Scouts, lasted two years before moving to Colorado to become the Rockies (the team subsequently moved to New Jersey in 1982-83 and changed their name to the Devils).

I included the standard deviations for the leagues in 1974-75 and 2013-14 (I haven’t compiled the data for 2014-15 yet, but this should be close enough), and even by those markers the Capitals compared markedly worse to their league than did the Sabres. But once again, the Capitals had a reasonable excuse, while the Sabres have walked into this situation with eyes wide open.

For those interested, I also put together 2-period shots-for and shot-against rates (and stretched them out to per 60 minutes) to get a rough sense of offense-versus-defense for both teams.

I added a couple extra filters to the charts, league-averages and standard deviations as well as 20-game moving averages in all the measures I used, which you can select by clicking on the grey “Team” bars and clicking on “Filter.”

2014-2015 Season Preview: The Metro Division

Image from Michael Miller via Wikimedia Commons

Last year, in preseason, the Metro Division, was considered by far the strongest division in the East and the likely bet to take both Wild Cards.  The whole division, minus the Pens, promptly started the season by getting hammered, only recovering later in the season to grab one of the two wild cards.

This year again, the top 5 of the division looks strong enough to take two wild cards.  The bottom 3, particularly the bottom 2, are very weak, but the top 5 is strong and near evenly matched such that they could wind up in any order.  But, given the requirement to project the division, these are how I believe the division should finish up, from worst to first:

Continue reading