
Last week I wrote about a new metric, ZEFR Rate, which measures zone entry success on the power play and is relatively repeatable and predictive of future goal scoring efficiency. The metric was based around the idea that getting into formation efficiently — most frequently a 1-3-1 — is a catalyst for power play success.
But now let’s say you’re a team that has perfected your entry scheme, and you find yourself setting up in formation at a consistent rate. What now? How can one maximize one’s use of possession in formation to score goals at the highest possible rate?

Let’s start by looking at this from another angle. What metric conceptually would be a good representation of whether a team is having success in formation? Well we would want time spent in formation to be the denominator, rather than simply overall 5-on-4 time. As for the numerator, would goal-scoring work (ie GF/60 formation mins)? It’s possible, but the sample size will likely be pretty small as with any goal-based metric. Would shot attempt generation work (ie CF/60 formation mins)? That way we would have a larger sample size, but there’s one problem. We like shot attempt numbers at even strength because they show that a team is getting into positions to shoot (driving the play in the right direction), and the same can even be said for overall power play numbers. But when a team is already set up in formation, players could shoot whenever they wanted. It may be that CF60 mins of formation time is predictive because players are smart, but registering a shot attempt certainly isn’t an accomplishment in and of itself. But we’ll get to that.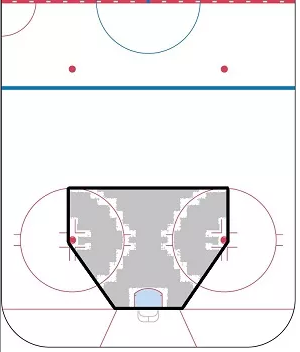
The happy medium here would seem to be scoring chances. If a team is getting scoring chances when set up in formation, that’s a pretty good sign that they are doing a good job with that particular aspect of the man advantage. When we talk about scoring chances, we’re normally referring to the home plate area (the inner and outer slot, basically, seen at left courtesy of Jewels From The Crown).
But we do that because of our lack of access to shot quality data. With the NHL’s play-by-play data, we mostly only have access to shot location. This season, though, I’ve been sure to track other indicators of shot quality. Using a few characteristics that I have found to increase shooting percentage, I have developed a new form of scoring chances that I have termed High Quality Chances (HQC). To begin with we won’t bother with whether or not the team is in formation. These will include all 5-on-4 shot attempts. High Quality Chances are composed of the following:
Terms:
CShPct = Goals/Shot Attempts
Pct Total Shots = Percentage of Total 5-on-4 shots tracked that fit this criteria
Pct Total Goals = Percentage of Total 5-on-4 goals tracked that fit this criteria
Home Plate Area Location Shots
CShPct: 9.00%, Pct Total Shots: 43.50%, Pct Total Goals: 68.10%
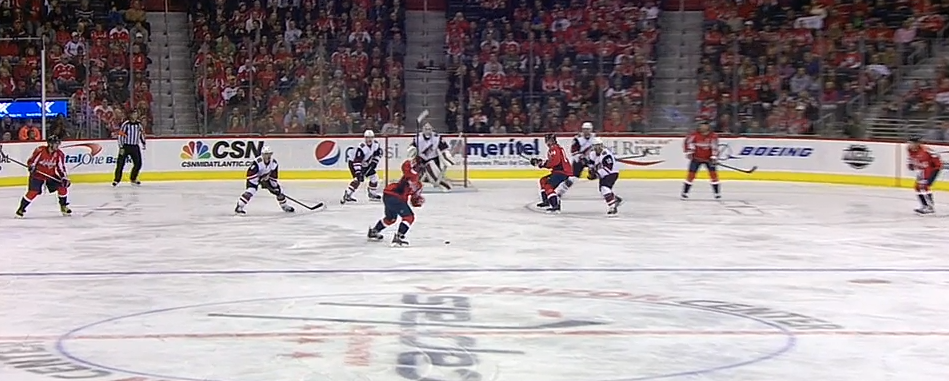
Home plate area chances are dangerous purely because of the proximity to the goaltender. Goalies have less time to react, and often have to retreat to give themselves time to slide across on a potential goal-mouth pass or deke, giving the shooter a better angle at the net. As seen above, Evgeny Kuznetsov provides the Washington Capitals with a dimension that even Nicklas Backstrom doesn’t, the ability to cut in for a quick and dangerous wrist shot.
As you can see from the numbers above, teams get home plate area shots off quite frequently, and almost 70 percent of the goals you see at 5-on-4 are from the home plate area.
Royal Road One-Timers
CShPct: 13.90%, Pct Total Shots: 3.70%, Pct Total Goals: 14.90%
The royal road is an imaginary line that extends from the center of the goal up through the top of the faceoff circles, splitting the lower part of the offensive zone into two east-west halves. The concept was created by former NHL goaltender Steve Valiquette and the idea is that shots preceded by the puck crossing that center line will go in a higher percentage of the time. You can read all about the Royal Road, and more of that fascinating research which was one of the inspirations behind some of my own shot quality work, here.
One-timers that cross the royal road are usually also scoring chances, but as with the Alex Galchenyuk goal scored above, they aren’t always. These shots are, however, dangerous because of forcing the goalie to move laterally a great distance at high speeds — one of the most difficult things for a goalie to do. While I have tried to keep each GIF representative of only one type of shot (no overlap), I would be remiss not to note that Brendan Gallagher provides an excellent pass screen prior to this goal. We usually think of screens as being purely on shots, but when it comes to one-timers, pass screens can be just as deadly. The goaltender here is unable to pick up on Galchenyuk’s shot quick enough because he is blocked from tracking the puck as it leaves P.K. Subban’s stick at the left point. Finally, since it’s something I’ve stressed since day 1, note how this play would not have been possible if Subban and Galchenyuk weren’t both playing their off-wings on the respective half-walls.
You can see from the numbers above that cross-ice one-timers aren’t particularly common; it usually takes a defensive breakdown for one as clean as this to become available. But you can see from the shooting percentage that they are incredibly dangerous.
Screened Shots
CShPct: 4.50%, Pct Total Shots: 24.90%, Pct Total Goals: 21.30%
Unfortunately, I only started tracking screens halfway through the season, so all of the numbers you see here are for the second half. The non-screen components, though, have been double checked using data from the first half, and the numbers line up pretty closely
At even-strength, hockey people likely overstate the importance of screens, as very little of the game consists of teams set up in the offensive zone in areas where screens are executable. On the power play though, that situation is half the battle. As I discussed on last week’s PDOCast, a team can allocate a minimally skilled net front player to fill that role on the power play, have that guy hardly touch the puck, and still have it as a net-positive. Because of the speed of the game and defense/offense split, something like that can’t be accomplished at even strength. It’s why players like Brian Boyle and Ryan White can be productive players on the power play, as long as they are put in a position to succeed and aren’t asked to do too much. It is also, though, why having a player like Wayne Simmonds or Anders Lee or even Justin Abdelkader who can play the net front role but still contribute to other aspects of the power play is a huge benefit when up a man.
Screens are hugely important on the power play. They turn a wasted shot into a scoring chance without too much difficulty, which is a huge advantage. I like to think of it like a half-court offense in basketball. You play 4-on-4, and then your big man in the post is guarded by their big man, aka their goalie. If you don’t have that guy there, though, you had better have a shooting threat like Alex Ovechkin/Steph Curry, because it’s going to be easier for the opposition to close down on point shots, and of course easier for the goalie to stop them.
Tipped Shots
CShPct: 15.20%, Pct Total Shots: 4.30%, Pct Total Goals: 12.80%
Tipped shots are an extension of screened shots. If you get traffic in front of the net, you are hoping for the possibility that the puck gets tipped on goal, and if not are settling for the screen. In my criteria, I defined tip-pass plays as one-timers, so this category is purely shots that would have been on-goal anyway, forcing a last second adjustment by the goaltender. Anders Lee is one of the best at this skill, as seen above where he manages to tip a Nick Leddy shot into the net despite being tangled up with a Penguins defender in front.
Tipped shots aren’t super common — tipping a shot with direction is one of the most difficult skills in the game — but they are deadly. It is the defenseman’s job to either front the shot — block it before it reaches the screening player — or tie up that offensive player’s stick so that the goalie gets a clean save opportunity.
Rebound Shots
CShPct: 12.20%, Pct Total Shots: 8.80%, Pct Total Goals: 19.10%
I am cheating a little bit including rebound shots in this definition. After all, you can’t tell a team “when you’re in formation just take rebound shots.” But they are certainly high quality chances and account for a large portion of 5-on-4 goals. So if teams can’t just take rebound shots, how can this knowledge be applied? Well, from past research, we know that certain types of shots produce more rebounds than others. Specifically, we know that screened and tipped shots produce more rebounds, and the data at least suggests that the same is probably true if to a lesser degree for general scoring chance and one-timer shots. Not-so-coincidentally, those are our other four High Quality Chance categories. So rebounds are the fifth and final category, but they are also contained within the other four categories. Take screened, tipped, home plate area and royal road one-timer shots, and the rebound goals as well as the initial goals, will come.
Here are all of those percentages displayed together:
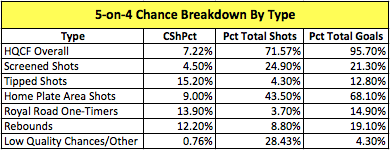
High Quality Chances For go in 7.22 percent of the time, compared to 0.76 percent of the time for non-High Quality (or “Low Quality Chances”). That means that if you attempt 132 shots on the power play that aren’t either from the home plate area, a Royal Road one-timer, a screened shot, a tipped shot, or a rebound, you will score on average on only one of them. Yeah.
As for High Quality Chances, as I pointed out in my presentation in Vancouver, they account for more than 95 percent of 5-on-4 goals among the teams I’ve tracked in the second half of the season. If we go back to the beginning of the season for a larger sample size and exclude screened shots (since I wasn’t tracking them for the first half), that number is still 85 percent. Additionally, a large portion of the Low Quality Chances that went in were Alex Ovechin one-timers from just outside the faceoff circle. Remove those, and suddenly Low Quality Chances become Wasted Chances pretty quickly.
So we’ve established some of the bigger factors that influence shot quality on the power play, but now we need to know whether we can use High Quality Chances as a repeatable or predictive metric. Going back to our original question about formation time, I looked at three different metrics:
Goals for per 60 minutes in formation
Shot attempts for per 60 minutes in formation
High quality chances for per 60 minutes in formation
As in last week’s piece, I looked at on-ice data for every player that fit a minimum ice time threshold (each dot is a player) and assessed repeatability (is this an actionable skill) and predictive ability (can we use this to determine how good a power play will be in the future).
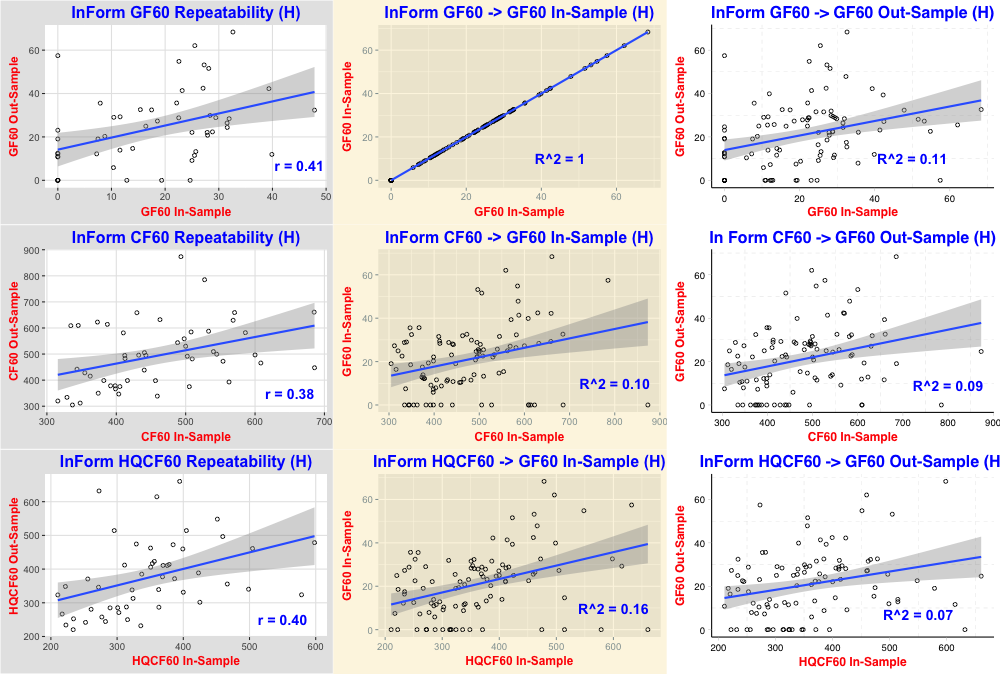
All three of these metrics show high repeatability, and they are very similar in terms of the extent to which they account for in-sample and out-sample goal scoring efficiency in formation. But the sample sizes are small, since we are only talking about half the season for five teams, and a quarter of the season for a sixth — in total approximately 100 goals.
Because it’s a larger sample size, let’s look at full season data. For the following plot, InForm HQCF60 doesn’t include screened shots.

Now suddenly the results don’t seem promising. Over the full season, none of these metrics predict out of sample goal scoring, and only shot attempt generation, despite the ease with which teams can get shots off in formation, is significantly repeatable.
The takeaway therefore is that more research needs to be done with more data. At this point, InForm HQCF60 is not a metric I would advise using to evaluate a power play. Still, it can be interesting to identify which teams and players have on-ice success at generating such chances. Here is the top and bottom 10 players I’ve tracked that met my threshold, starting with the full season. 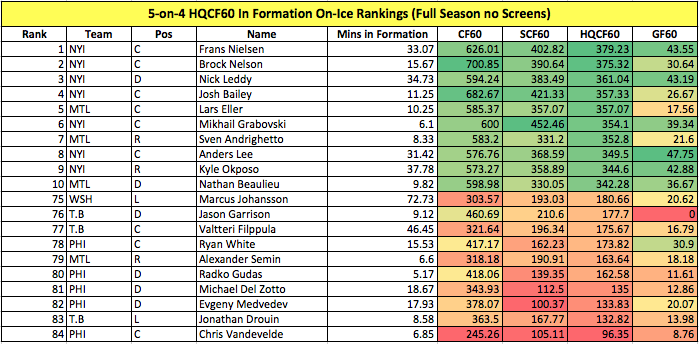
The New York Islanders, despite having trouble with entries, do well once they finally do get set up. The Philadelphia Flyers’ second unit the first half of the year did not perform well, as evidenced by this data. As for Alex Semin, it once again doesn’t appear as though he was helping the Montreal Canadiens power play all that much. You can see the entire full-season rankings here.
Now what if we look at the best and worst on-ice performers in only the second half of the season, when we include screened shots.

Once again the Islanders look prolific, which is no surprise when you consider the importance of Anders Lee in front of the net for their first unit. When it comes to the Capitals’ second half power play slump, as well as some entry difficulty, both of the team’s units also weren’t doing a very good getting off high quality shots (or really any shots) once set up. You can see the full list of half-season performers here.
So if we can’t use HQCF60 as a reliable metric — at least not as currently constructed — what is the takeaway from all this? High Quality Chance Generation may not dictate evaluation, but it can inform coaching. If the data from the other 24 teams bears out the fact that Low Quality Chances, as I’ve defined them, are wasted shots, then coaches should tell their players not to take those shots. They should have rules and guidelines of when players should be able to shoot. A wasted shot is a wasted possession, which often means a wasted 30 seconds, and even more so than at even strength, on the power play minimizing waste is crucial.
