How Can We Quantify Power Play Performance In Formation?

Screen Shot 2016-02-26 at 4.55.31 PM

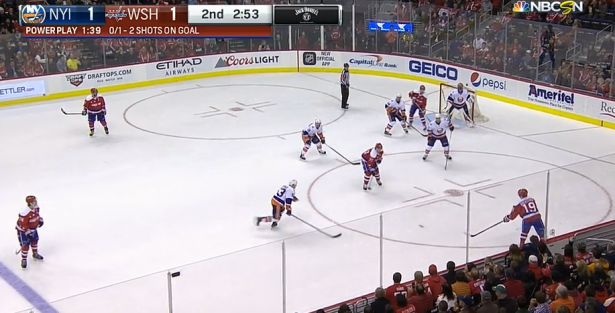
Last week I wrote about a new metric, ZEFR Rate, which measures zone entry success on the power play and is relatively repeatable and predictive of future goal scoring efficiency. The metric was based around the idea that getting into formation efficiently — most frequently a 1-3-1 — is a catalyst for power play success.

But now let’s say you’re a team that has perfected your entry scheme, and you find yourself setting up in formation at a consistent rate. What now? How can one maximize one’s use of possession in formation to score goals at the highest possible rate?

Continue reading

ZEFR Rate: A New and Better Way to Evaluate Power Plays

Screen Shot 2016-04-17 at 4.49.36 PM

Some day we will reach the point where we can comprehensively analyze which power plays are the best, which players drive that success, and most elusively, what roles to place players in to maximize a unit’s output, but statistically, our special teams cupboard is pretty bare. This season, as many of you know, I took on the long and arduous task of hockey tracking in the interest of trying to get us even one step closer to our objective: how can we better evaluate and predict power play success? So let’s dive right in. Continue reading

Can We Accurately Predict Which PK Units Will Score Shorthanded?

Embed from Getty Images

Last week I went on Montreal radio and talked about how dangerous the Ottawa Senators’ penalty kill units are. Led by speedy forwards like Curtis Lazar, Jean-Gabriel Pageau and Mark Stone, and with help from puck moving genius Erik Karlsson, the team has feasted on opposing power plays this year to the tune of the highest GF/60 minutes shorthanded in the league since at least 2007-2008. When considering the team’s league worst GA/60 — mixed with a little bit of film — it becomes clear that the Senators yield chance against in exchange for opportunities for on the break. It may not have been intentional at first, but once the team started capitalizing on its rushes, it seems likely coach Dave Cameron gave his players the green light to go, to try and come out on top on aggregate. The result? While being last in GA/60 shorthanded, the Senators are third in GF%. The problem with GF% when it comes to special teams though is that volume matters more when the ice is tilted. Two goals for and Eight goals against isn’t the same as Four goals for and 16 goals against. So goal differential per 60 is a more accurate measure of success on special teams. The Sens are 30th in GD/60 shorthanded, so it’s hard to say the strategy has been that much of a positive for the team (unless, say they’re down a goal and shorthanded near the end of a game).

Continue reading

Special Teams Analytics in the 21st Century

BestPPPredPlot1

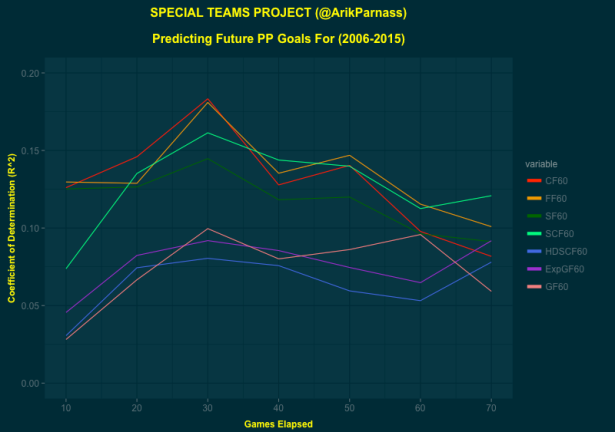
Despite them accounting for approximately 20 percent of NHL game time, special teams have been largely ignored when it comes to analytics. Considering the data available and its small sample size compared to even-strength, that is somewhat understandable, and there have certainly been attempts to properly quantify and assess power plays. So what do we know so far? Continue reading

Has the NHL’s new faceoff rule increased goal scoring?

Mise au jeu BOS @ MTL Faceoff” by Fleurdelisé. Licensed under Creative Commons via Commons.

Over the summer, the NHL made a number of significant rule changes to make the game more entertaining to fans and more fair for teams, with 3-on-3 overtime being the most revolutionary and thus far the most applauded.

Buried down at the bottom of the list of rule changes, however, was a much less significant note. It involved faceoffs – you know, that thing data analysts get peeved at commentators for overemphasizing. For years, the standard procedure has been that the visiting team’s player is required to put his blade on the ice prior to his opponent. This is an advantage for the home player, as he can attempt to secure the puck back to his side with one consistent motion rather than having to move his stick forward and then backward.

Continue reading

Revisiting Imbalanced Drafting Strategies

Photo by user

Photo by user “Tsyp9”, via Wikimedia Commons.

At Hockey-Graphs, we like to provide data-based answers to questions. It’s what we do. But it’s also good to recognize issues in the analytics world that haven’t yet been addressed. Sometimes that’s the case because we don’t have the data we need available, and sometimes it’s because the question has yet to be properly framed. It’s important to know what we don’t know, and to talk about it regardless.

There has been some great draft work done at our site and elsewhere in the last few years, and one of the findings has been the volatility of drafting defensemen relative to forwards. Couple that with claims that forwards have more of an impact on shot rates than defensemen, and one would be tempted to claim that avoiding defensemen altogether would be a solid draft strategy (though I’ll note that most analysts think this is taking the conclusion too far).

Continue reading

A Look into Alex Ovechkin’s Elite Power Play Abilities

"Alex Ovechkin2" by Keith Allison. Licensed under Public Domain via Commons.

Alex Ovechkin2” by Keith Allison. Licensed under Public Domain via Commons.

I don’t know if we’ll ever see a power play quite like that of this decade’s Washington Capitals. We can’t attach a firm date to it because it could extend as far as the end of Alex Ovechkin’s career at this rate, but we know that its peak of power began with the hiring of Adam Oates as Caps head coach back in 2012. Oates had run a successful 1-3-1 power play for the New Jersey Devils with Ilya Kovalchuk as his trigger-man, but nothing even close to the heights he managed to achieve with the man advantage in his two seasons in DC. Barry Trotz, to his credit, has kept the same formation — what’s that old adage about things that ain’t broke? — with only minor tweaks, and last year the power play continued to succeed.

Now there’s a lot to discuss about the formation and its success — I like to think of the Caps’ PP as a work of art more than anything else — but for the sake of this post I’m going to focus in on Alex Ovechkin. Never has there been a more criticized future first-ballot Hall of Famer, nor arguably a more controversial elite goal scorer. It should already be a given that Ovechkin is the best power play goal scorer of all time — he sits fifth overall in PPG/g despite playing in a significantly lower scoring era than his contemporaries like Mike Bossy and Mario Lemieux — but I would argue by the time he retires, he will also likely be the greatest goal scorer of all time period. It’s the man advantage recently, in the latter stages of Ovechkin’s goal scoring peak, that has been the sniper’s bread and butter. Since Oates brought the 1-3-1 to town, Ovi has scored 48% of his goals on the power play, compared to 33% prior to that. He scored 25 power play goals last year, six ahead of the next highest total in Joe Pavelski’s 19. You have to go back another five to reach the player who is in third — Claude Giroux with 14 — indicating how great of a season the Sharks’ center/winger had, but that’s a story for another day.

Continue reading

Exceeding Pythagorean Expectations: Part 5

“Bryz-warmup” by Arnold C. Licensed under Public Domain via Commons.

Bryz-warmup” by Arnold C. Licensed under Public Domain via Commons.

This is the fifth part of a five part series. Check out Part 1, Part 2, Part 3, Part 4 here. You can view the series both at Hockey-Graphs.com and APHockey.net.

To quickly recap what I’ve covered in the first four parts of this series, I have updated the work that’s been done on Pythagorean Expectations in hockey, and am looking to find out whether teams that have the best lead-protecting players are able to outperform those expectations consistently.

The first step is to figure out how to assess a player’s ability to protect leads. To do this, for every season, I isolated every player’s Corsi Against/60, Scoring Chances Against/60, Expected Goals Against/60 (courtesy of War-On-Ice) and Goals Against/60 when up a goal at even strength. I then found a team’s lead protecting ability for the year in question by weighting those statistics for each player by the amount of ice time they winded up playing that year. For players that didn’t meet a certain threshold, I gave them what I felt was a decent approximation of replacement level ability. For example, here was the expected lead protecting performance of the 2014-2015 Anaheim Ducks in each of those categories.

Screen Shot 2015-09-12 at 4.04.51 PM

Now let’s look a little closer at our Pythagorean Expectation — derived through PythagenPuck.

Continue reading

Exceeding Pythagorean Expectations: Part 4

“Zdeno Chara 2012” by Sarah Connors. Licenced under Public Domain via Commons.

Zdeno Chara 2012” by Sarah Connors. Licensed under Public Domain via Commons.

This is the fourth part of a five part series. Check out Part 1, Part 2, Part 3, Part 5 here. You can view the series both at Hockey-Graphs.com and APHockey.net.

So now, four parts into this five part series, is probably a good time to discuss my original hypothesis and why I started this study.

As I mentioned in my previous post, baseball has already gone through its Microscope Phase of analytics, where every broadly accepted early claim was put to the test to see whether it held up to strict scrutiny, and whether there were ways of adding nuance and complexity to each theory for more practical purpose. One of the first discoveries of this period was that outperforming one’s Pythagorean expectation for teams could be a sustainable talent — to an extent. Some would still argue that the impact is minimal, but it’s difficult to argue that it’s not there.

What is this sustainable talent? Bullpens. Teams that have the best relievers, particularly closers, are more likely to win close games than those that don’t. One guess that I’ve heard put the impact somewhere around 1 win per season above expectations for teams with elite closers. That’s still not a lot, but it’s significant. My question would be, does such a thing exist in hockey?

Continue reading

Exceeding Pythagorean Expectations: Part 3

“Pythagorus Algebraic Separated” by John Blackburne. Licenced under Public Domain via Commons. The 2006 Red Wings may have been the best hockey team since the lost season.

Pythagorus Algebraic Separated” by John Blackburne. Licenced under Public Domain via Commons. The 2006 Red Wings may have been the best hockey team since the lost season.

This is the third part of a five part series. Check out Part 1, Part 2Part 4, Part 5 here. You can view the series both at Hockey-Graphs.com and APHockey.net.  

Since the last post was getting a little long, I decided to hold off on releasing the full Pythagorean results.

Continue reading