

Photo by “JulieAndSteve”, via Wikimedia Commons
Gabe Desjardins dropped a comment over at my Tumblr awhile ago, asking me if I could put together a graph expanding on a metric I came up with, 2-Period Shot Percentage (or 2pS%). 2pS% is an historical possession metric that takes shots-for and shots-against in just the first two periods of a game and expresses it as a percentage for the team being analyzed. The idea was that I was trying to get a rough possession measure from the period that would avoid score effects, or the tendency for teams with a lead to sit on the lead and thus give up shots late in the game. Having recently completed a database of period-by-period shot data going back to 1952-53, I have been able to test this metric a bit and the results were good for 2pS% as a possession measure. Returning to Gabe’s request, he wanted to know if I could chart the 2pS% data from year-to-year, with one line following the league leader in the metric and the other line following the Stanley Cup winner. I’d been curious about this myself; certainly there are a number of different ways to express the value of the metric, but this particular one could be interesting because it toes the line between what the Old and New Guard feel is important in this kind of analysis.
Well, I was right that it would be interesting:
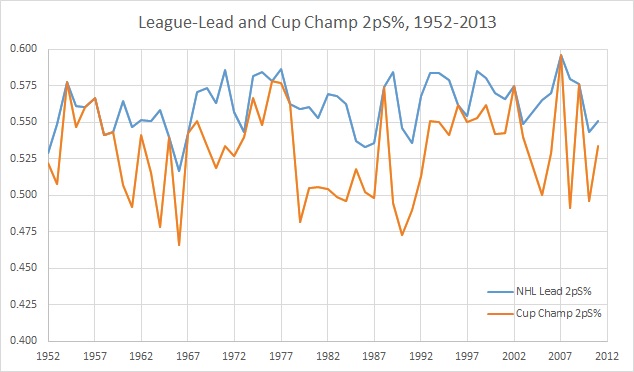
Note: From this point forward, year is indicated by the first year of the season; for instance, “2012” equals “2012-13”
They run together quite nicely if you can see through the noise. You’ll notice, for instance, that your league average (.500) is more often than not the low-water mark, with the notable exception of the 1980s. Overall, in 60 years the leader in 2pS% won the Stanley Cup 15 times, and lost in the Finals 11 times. Only once did the leader fail to make the playoffs, in the case of the 1961-62 Detroit Red Wings. Personally, I’d say making the playoffs should be the primary barometer of success; it typically involves sustainable and/or sustained success, whereas the playoffs themselves can be a bit of a crapshoot by the Cup Finals.
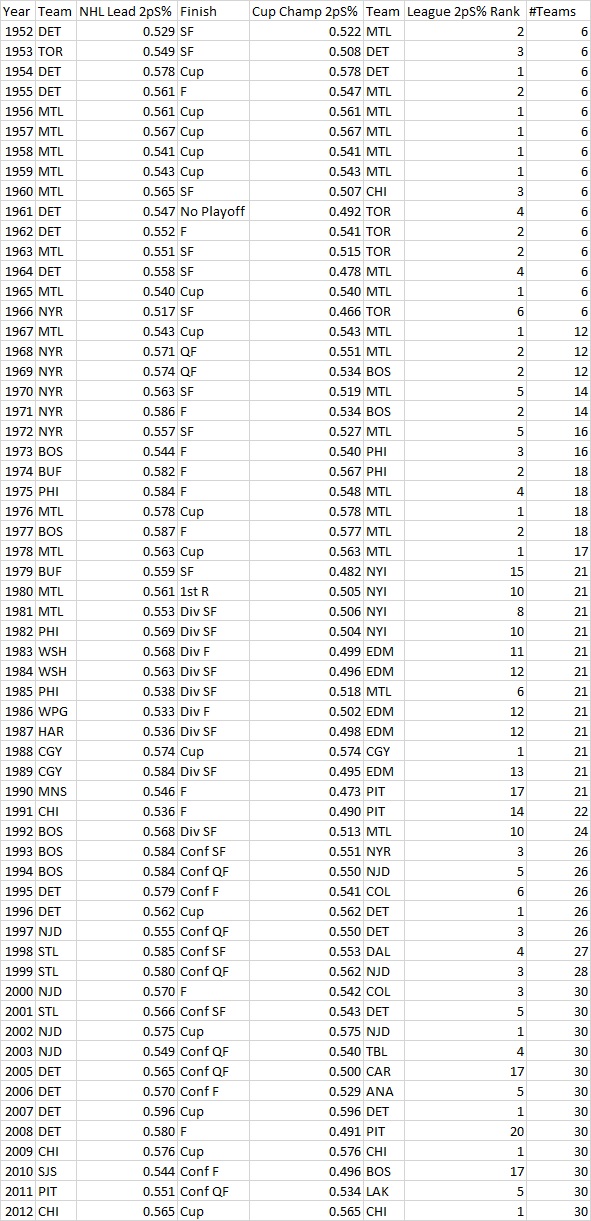
Ultimately, your Stanley Cup winner averaged 0.532, which would annually, on-average, place them firmly in the top-third in the league during this 60-year sample. If you want to look into the data further, here’s the table:
Of course, within this data there are some more interesting trends; to draw them out, I did a second chart of the same data, this time making my lines with 10-year rolling averages:

Note: Ignore the “10GP” there; supposed to read “10 Year”.
As you can see, the movement between 2pS% leaders and Cup winners strikes a steady balance, only interrupted by the 1980s. To be clear, the 1980s were a messed-up decade (it’s primarily responsible for our current jean jacket population), but NHL-wise it fit into a very prolific scoring stretch for the league, one that actually (for large part) came to a close after the 1992-93 season. During this stretch, three dynastic teams amassed a peculiar amount of primarily offensive talent in the New York Islanders, Edmonton Oilers, and Pittsburgh Penguins. This era probably needs even more investigation, but I’d argue these teams were able to lean on their talent to out-offense their opponents, which can be easier when you boast virtually unprecedented skill (Bossy, Gretzky, Lemieux) with a Hall of Fame “supporting cast” (Trottier, Potvin, Gillies, Kurri, Coffey, Messier, Francis, Jagr, Coffey again…Phil Bourque).
Lost in the Cup exaltation are some remarkable possession dynasties, including the 1970s New York Rangers and Buffalo Sabres, 1980s Philadelphia Flyers, 1990s Boston Bruins and St. Louis Blues, and the 2000s Ottawa Senators and San Jose Sharks. Though none of them won the big one, they all were making the playoffs and, in some cases, making it all the way to the Cup Finals.
Whatever the case, add this to the growing stack of evidence for the importance of possession.

The importance of possession is widely accepted. This tells me that it’s not the only way to skin a cat although it may be the most reliable. If only we could see through the noise of shooting percentages. I suppose we know who the high percentage guys are at least at the extreme but its hard to judge smaller differences between players in this aspect. It seems easier to judge smaller differences in possession ability.