Examining Player Development in NCAA DI Women’s Hockey with Game Score Pt. 2

Continued from Pt. 1

When do women’s hockey players reach their peak? How do they develop? These questions may sound straightforward, but they are exceedingly difficult to answer because of the finite opportunities for players to pursue high-level post-collegiate hockey. There is no consensus “top” professional league in the world, and major international tournaments are brief; conclusions we draw from them can be heavily skewed by the group format.

For all these reasons and more, NCAA DI (Division I) is a logical place to explore player development. It is data-rich, relative to the rest of women’s hockey, and Carleen Markey’s work with aging curves placed CWHL (Canadian Women’s Hockey League) skaters’ peak offensive production between the ages of 22 and 23. That falls within the range of many collegiate careers.

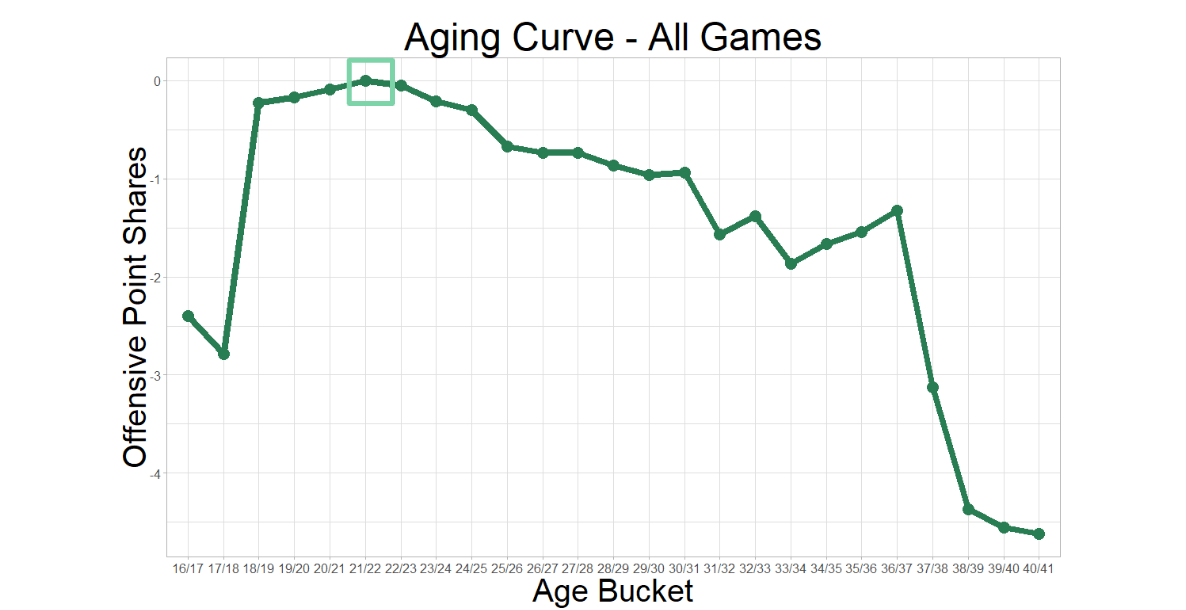
Credit: Carleen Markey

The Pipeline

The zenith of skill and competition in the world of women’s hockey are the Olympics and the IIHF Women’s World Championship. These tournaments are filled with, and often dominated by, active DI players and alumnae. As one might expect, the majority of those players represent Team USA and Team Canada.

At the 2019 Worlds in Espoo, Finland, all of Team USA’s roster and 20 of the 23 players on Team Canada spent at least one year in an NCAA DI program, compared to just five of the 23 players on Team Finland’s silver medal-winning team, and one player on Team Russia’s fourth-place team. 

That said, there are more international players playing college hockey in North America every year. Per biographical data on EliteProspects.com, the ratio of international players in DI hockey climbed from 4.17 percent in 2015-16 to 5.07 percent in 2019-20.

Those percentages don’t mean much without the context of the women’s hockey landscape across the globe. According to the IIHF, there are 88,732 registered female players in Canada and 82,808 in the U.S. Outside of North America, there are 26,381 registered players in Sweden, Finland, Czech Republic, Russia, France, Germany, Switzerland, Japan, and Norway combined.

Continue reading

Examining Player Development in NCAA DI Women’s Hockey with Game Score Pt. 1

Carleen Markey broke new ground with her presentation on women’s hockey aging curves in the CWHL (Canadian Women’s Hockey League) at RITSAC 2019. Her work, which was built from the scaffolding of the Evolving Wild twins’ aging curves, established that offensive production among CWHL skaters peaked around age 22 to 23. That work by Markey got me thinking about how players developed just before going pro in North America and Europe, and/or becoming fixtures on national teams.

So, I set my eyes on NCAA DI (Division I) women’s hockey.

DI schools have served as the primary pipeline of talent for Team Canada and Team USA for decades. Furthermore, DI schools have served as a valuable proving ground for many of the most talented European players in the world. With Carleen’s work in mind, I set out to analyze how skaters developed in DI hockey before they reached their peak production years and their athletic prime.

Approach 

The greatest obstacle to any statistical analysis of the women’s game is the scarcity of public data. Fortunately, NCAA DI is something of an exception because of sites like collegehockeystats.net, collegehockeynews.com, and the database on HockeyEastOnline.com.

I decided on developing a game score for DI hockey to serve as an all-in-one stat that could provide a rough measure of a player’s overall impact or value. Dom Luszczyszyn first applied game score to hockey, and his work provided a framework. Creating game score for DI hockey was also appealing because I was able to apply lessons learned from working with Shawn Ferris’ NWHL (National Women’s Hockey League) game score. At the time, this sounded like fewer headaches for me. I was wrong; I had forgotten how many headaches there were the first go around.

Continue reading

How to Debug Data Science Code

Think of everyone who has a talent you admire. Athletes, writers, anyone. If you were to ask each of them for the secret to their success, how many of them would be able to give the true answer? I’m not saying that they would deliberately lie. Rather, it’s just genuinely very hard to objectively assess oneself and turn natural implicit behaviors into explicit lessons that can be described to others.

Implicit lessons can be a barrier to people learning new skills: it’s much harder to learn something if their instructor doesn’t know it’s something they ought to teach. The best teachers are able to put themselves into the shoes of their students and convey the most important pieces of information.

One area of data science that is too often left implicit is troubleshooting. Everyone who writes code will get error messages. This is frustrating and can halt progress until solved. Yet most resources devoted to teaching new data scientists don’t discuss what to do, as if they’re expected to study enough to code everything correctly the first time and never encounter an unexpected error. You can find articles about common mistakes that data scientists make, but what about when you inevitably make an uncommon one? There are very few resources around how to debug broken code. (This one is quite nice, and these two are worth a read as well.) 

That’s what I’m hoping to partially remedy with this article. It’s far from the single canonical process for debugging, but I hope that it helps people get unstuck while they learn. The key points I want to convey are:

  • Every data scientist hits an error messages regularly, and doing so as a new programmer is not a sign of failure
  • Isolate the issue by finding the smallest piece of code that creates the problem
  • The exact language of an error message can be extremely helpful, even if it doesn’t make sense
  • The internet is (only in this particular instance) your friend, and there are particular resources that are particularly helpful for solving problems

Continue reading