
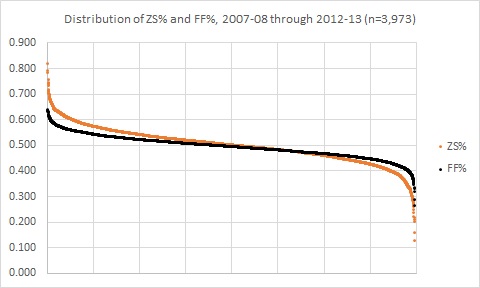
The image above is the distribution of individual offensive zone start percentage (or the percentage of times a player started their shift in the offensive zone) and the distribution of individual Fenwick percentages (shots-for and shots-missed for that player’s team divided by all shots-for and shots-missed, both teams, all tabulated when that player is on the ice). I specifically targeted player season performances wherein the player participated in at least 20 or more games, as that’s roughly around the number of games it takes before these measures start to settle down.
These distributions tell us a few important things for understanding possession, deployment, and how we might analyze the game. Most importantly, after the jump I have a modest proposal, a 60-40 Rule, that might help us in the chase for those elusive, all-encompassing player value metrics.
In the distribution above, you see a wide range of zone-start deployments, going all the way from Aaron Downey’s 82.1% in 2007-08 to Manny Malhotra’s 13.2% in 2011-12. In between, you see a variety of deployment schemes, ranging from Alain Vigneault’s drastic all-offense, no-offense zone starts (of which Malhotra was a “beneficiary”), to Todd McLellan’s near-parity across his lines. For all that tinkering, we’ve still come to have a pretty steady distribution of possession (read: Fenwick percentage) results: 60-40. In other words, looking at the distribution, an overwhelming majority of the player performances fall between 60% and 40%.
What’s more, for those who have fallen outside of that 60-40 (88 out of 3,973 performances, or 2%), they pull back towards 60-40, heavily. Take, for instance, the 58 players who fell below 40, of whom only 26 recorded a following 20-game season to analyze:

That group, which recorded a combined 38% Fenwick in their sub-40 season, averaged 44% Fenwick the following season. Though certainly aided some by their zone starts getting nudged from 43% to 47%, the correction definitely suggests that expecting or projecting a sub-40% season is probably ill-advised. Also worth noting is that only four of the above seasons involve players saddled with sub-40% zone starts. On the other hand, 30 of our 30 players that performed 60% Fenwick or above recorded 20-game seasons the following year (understandably; they were far less likely to get cut than their sub-40% counterparts!):
This group, that recorded an average of 61.5% Fenwick in their above-60 season, followed with an average of 55.5%. Once again, it’s not out-of-question to note the change in zone starts, as they decreased for the players above from an average of 58% to an average of 55%.
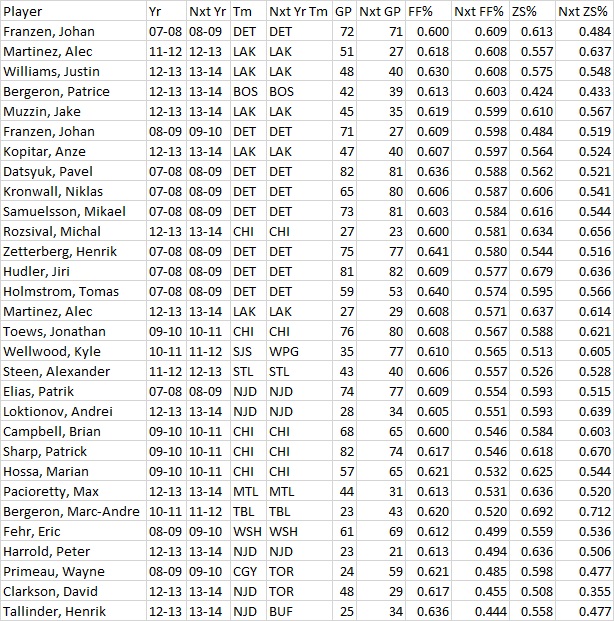
Sharing even more-exclusive company were those players who managed consecutive sub-40 or above-60 seasons:

Hmmm, something seems quite consistent among that bottom group…and let’s not forget Ryan Johnson as part of Don Cherry’s anti-Corsi tirade from a couple of years back. And then there’s poor Jay McClement, saddled with crap zone starts on a crappy possession team. Forever alone.
The top group is more interesting; at least two of the players, Franzen and Martinez, are not guys you would say “drove the boat” on their respective teams. Williams, I think, is at least a co-driver on the Kings. Bergeron, on the other hand, is definitely vital to his team’s play, and is Datsyukian in his completeness as a player. That said, he still has another half-year to keep it up.
Whatever the case, to reach the kind of heights that might supersede the 60-40 rule, you definitely need to be surrounded by a supreme supporting cast.
At the team level, the 60-40 Rule seems just as sound, as suggested by this distribution of historical possession figures:

Only one team in the past 60 NHL seasons fell outside my historical possession metric, the 1974-75 Washington Capitals, a team that by all measures was the worst team in NHL history (in their defense, they were an expansion team when talent was diffused by the then-14-team World Hockey Association). The 2-Period Zone Time% for teams in 2000-01 and 2001-02 give an even tighter distribution, from 45% to 53%.
What we can see here is that, even historically, hockey tends to hold pretty steady in a 60-40 possession rule, where teams almost universally fall between those parameters. It might even just be a consistency among free-flowing, possession-type sports, as 60-40 seems to be a familiar split in soccer as well.
A person trying to build a player value metric, under the 60-40 Rule, might then ask themselves what a player might do to move the needle within those 20 points. Maybe a team is -10 to +10, and a player’s contribution to that end result is expressed as a part of that number between -10 to +10 (with the potential to go beyond that in extraordinary cases). Maybe within that, a goalie is set aside a stable 5 of those 20 points, within which they can be -2.5 to +2.5. However a person would want to break that down, holding to a 60-40 Rule seems to align well with both macro- and micro-stats from the past.
Ultimately, the inspiration for the 60-40 Rule is not focused on analyzing past performances, but rather projecting future performances (essentially a stats equivalent of moving from correlation r to predictive model r-square). It’s the kind of thing that could be monitored in case the rule might change, but with this many seasons, and this many performances pulling so hard back-to and within 60-40, this might be something worth building on.
Note: Really, my intention here is to throw out the idea for discussion. Feel free to bat this idea of a 60-40 Rule around in the comments.

7 thoughts on “A Rule of 60-40: Thoughts on Individual Player Possession Metrics”