Last month, the NHL Central Scouting Service ranked 401 draft-eligible skaters in four separate categories: 217 North American skaters, 140 European skaters, 31 North American goalies, and 13 European goalies.*
Should we care about this?

Last month, the NHL Central Scouting Service ranked 401 draft-eligible skaters in four separate categories: 217 North American skaters, 140 European skaters, 31 North American goalies, and 13 European goalies.*
Should we care about this?
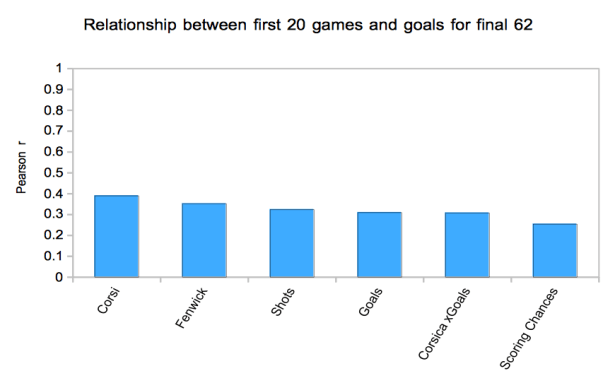
The above graph is a slight variation of the method employed by JLikens (Tore Purdy) six years ago, almost to the day. The variation being the method I used was extremely simplified. All I did was look at the correlation between each metric for the first 20 games with goals for the next 62 games in the season, with both variables being 5v5 and adjusted for score and home/road venue. I also skipped the lockout shortened season for insufficient games.
Welcome to The Hockey-Graphs Podcast! Our first episode showcases Ryan Stimson‘s recent article; Identifying Team Playing Styles With Clustering. Ryan and Adam discuss: how the piece came about, the methodology of the clustering, the pros and cons of each individual cluster and how to use this data to better team results. Any comments are appreciated, the goal is to produce a podcast that people want to hear.
Reach out on Twitter! The podcast will be on iTunes within the next few weeks, until then please listen through Soundcloud!
After the conclusion of the 2017 Stanley Cup Quarterfinals, I looked at whether a team’s hits for and against were indicative on their play. By looking at a team’s Corsi for percentage per game and expected goals for per game, against their cumulative hits as their first round progressed, it could be observed whether a team’s production dropped due to being outhit.
As it was explained in the first part of this series, many hockey traditionalists point to an increased number of hits as a necessity to compete for the Stanley Cup. There is a preconceived notion by some hockey minds that a team will become worn out if they are consistently outhit in the playoffs and subsequently will not be able maintain their production. However, in the 2014-15 season, 2015 playoffs, and 2016 playoffs, no decisive correlation was found between success and hits.
On Monday, I introduced some work on quantifying and identifying team playing styles, which built upon my earlier work on identifying individual playing styles. Today we’re going to discuss how to make this data actionable.
What are the quantifiable traits of successful teams? What plays are they executing that makes them successful? How can we use data to then build a style of play that is more successful than what we’re currently doing? The way we bridge the gap between front office and behind the bench is by providing data to improve their matchup preparation, lineup optimization, and enhance tactical decisions.
This is what I mean by actionable: applying data-driven analysis and decision-making inside the coach’s room and on the ice. All data is from 5v5 situations and is either from the Passing Project or from Corsica.
Last time, I looked at individual playing styles by clustering players together based on various passing metrics. Today, I’m going to use a similar approach to identify team playing styles and what we can learn about them. I got the idea watching this video on NBA offensive styles (stick tap to @dtmaboutheart for the link). It’s been sitting in my unfinished pile for a while, but I was spurred on to finish it by some comments made about the Washington Capitals and Pittsburgh Penguins series, which I will delve into tomorrow. Today’s piece is to going provide examples of how passing metrics can provide more detailed and actionable scouting reports for a team’s offensive and defensive tendencies.
All data is form 5v5 situations and is either from the Passing Project or Corsica.
There has been a lot of talk about parity in the NHL lately. Specifically shot attempt parity. The dispersity of corsi for percentage is more centralized this season than any season in the past decade, and people have
https://twitter.com/JeffVeillette/status/856909962680954882
This visualization is hard to read, but if we graph the standard deviations of corsi, expected goals (Corsica), and goals, we can get a pretty good idea of the movement towards or away from parity.
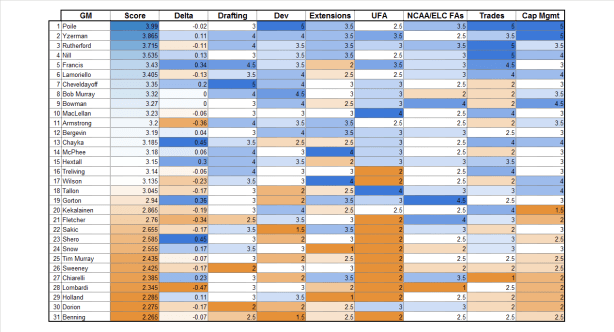
It’s been a crazy couple of days writing up this general manager project. If you haven’t already, please read the methodology before checking out our final list of rankings.
When going through the final rankings there were several interesting things that only show up when the data is viewed holistically. Here are some of our big findings that didn’t make it into the rankings piece.
(This piece was written as a collaboration between Carolyn Wilke and Chris Watkins)
Alright, we’re only a little bit sorry we made you read our methodology post first, because we know what you really want is below. Still, we recommend you understand how we came to our ratings before you continue reading this post.
We’re sure you’ll disagree with us on some points, and that’s fine – despite our best efforts, these are still fairly subjective ranks. Still, try this exercise for yourself, and it’s possible your opinions will change.
Now, without further ado – all 31 GMs, ranked.
(This piece was written as a collaboration between Carolyn Wilke and Chris Watkins)
What makes a good general manager in the NHL?
It’s a hard question, plagued by subjectivity, by bias, and by lack of transparency. It’s complicated by league mandates like the expansion draft and the hard salary cap. It mixes the weight of process, results, and vision into one big stew, where it can be difficult to distinguish the meat from the sauce.
It’s a question, that unlike many others, is difficult to quantify with even the most advanced of stats.
And it’s one that the league has no desire to answer definitively, as that would only hurt the men currently in those roles.
Fortunately for you, Hockey Graphs loves tackling the hard questions.
In the following articles, we will attempt to rank all 31 of the NHL’s GMs, as objectively as possible, according to seven important criteria. They each painstakingly researched trade histories, draft selections, and salary cap management, coming up with a final score for each.
While this process still was subjective, in that these scores are not quantitatively derived, it was an extremely holistic process, and both of us were forced to confront some of our own biases.

