Some day we will reach the point where we can comprehensively analyze which power plays are the best, which players drive that success, and most elusively, what roles to place players in to maximize a unit’s output, but statistically, our special teams cupboard is pretty bare. This season, as many of you know, I took on the long and arduous task of hockey tracking in the interest of trying to get us even one step closer to our objective: how can we better evaluate and predict power play success? So let’s dive right in.
As I stressed in my recent presentation at the Vancouver Hockey Analytics Conference, power play thinking is in many ways archaic. The core tenets of hockey special teams more closely resemble football than they do even strength hockey, and yet the product we observe during man advantages is nowhere near the structured, polished, well-defined package we get when we watch Aaron Rodgers drop back in the pocket.
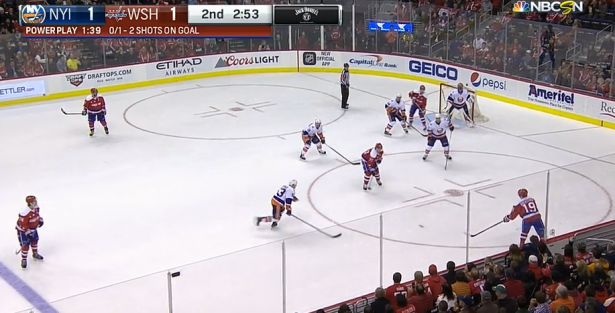
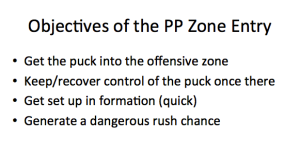
Nowhere is this more evident than on power play entries, where timing and consistency seem in the mind of coaches of negligible importance. I believe one of the oversights when it comes to entry planning is a failure to establish concrete goals. So what are the primary objectives of a power play breakout?
The first two are predictable, identical to what players intend to accomplish with zone entries at even strength, but the latter two — and especially the third — are unique to power plays. Some coaches stress the importance of a consistent formation, while some prefer a more reactive approach. Thanks to the data I tracked this year, I was able to compare the merits of each of those schools of thought.
The left-most graph above shows shot attempt generation (CF60) for each team, split by offensive zone situation: red is in formation, green is out of formation, and blue is on the rush. In the middle we see the same but for shooting percentage (CSh%) in each situation. Finally, on the right these two metrics are combined to give us goal generation (GF60).
Though I am only looking at six teams here, the numbers appear decisive. Getting into formation for a power play unit is an important part of clicking at a high rate, no matter who you are. And that all starts with the regroup.
The only team that has consistently impressed me on power play entries in the NHL has been the Washington Capitals, a team that this season came only a decimal point away from leading the league in power play efficiency for the fourth straight year, largely because of the amount of time they spend in formation.
This is the Single Swing, the Capitals’ primary zone entry play; they didn’t invent it, but they use it more than any team in the league, and it’s alarmingly effective. I don’t think it’s a coincidence that the above diagram looks like a page out of a football playbook, and note how every player on the ice has a specific role. Even T.J. Oshie, who likely won’t touch the puck, is used as a decoy to open space at the top of the ice, making the puck carrier’s task significantly easier. This play is also designed and implemented in the interest of limiting the time it takes the team to get set up once in the zone. Every player enters at the east-west location where they will ultimately reside and quite possibly score. The Caps can consistently be in formation 2-3 seconds after entering the zone, something very few other teams can say. Here are a few examples of that entry scheme:
The Capitals employ the Single Swing on about 50 percent of their full regroup attempts, and it delivers at a phenomenally high rate compared to the team’s other options, as well as to other teams.
Now that we know how critical formation time is, thus placing importance on players and entry schemes that can procure it, let’s return to my original question. How can we better evaluate power play players and units? I created a metric using this year’s data to assess which players and teams are best and worst at accomplishing the power play entry objectives previously discussed.
A zephyr is a favorable wind, so just as we say a good Corsi rate is a proxy for driving play, a player with a good ZEFR Rate can be said to blow man advantage play in the right direction. Now as with any metric that one hopes to use in evaluation, ZEFR Rate must be tested.
In the above matrix of scatterplots, you see three different explanatory variables (one on each row): Goals for per 60 at the top, Shot Attempts for per 60 in the middle, and the aforementioned ZEFR Rate at the bottom. Each dot you see represents the on-ice statistics for one player.
The left column shows how repeatable each of these metrics are, or how much of an applicable skill each represents (as opposed to simple variance). We determine this by splitting our sample into even and odd games and calculating the correlation between each half of games for each player. The larger the correlation, the more repeatable the metric.
The second column lays out how much of in-sample goal scoring efficiency each metric accounts for. For example, among the players I’ve tracked, Evgeny Kuznetsov leads the league in on-ice goals for per 60 minutes at 5-on-4. On average, how much is that number derived from zone entry success. The answer at the player level is 17%.
The third column displays, maybe most importantly, how predictive each is of future success. So if we look at our even and odd games, how much of the variance that we see in out-of-sample on-ice goal scoring efficiency is accounted for by our explanatory variable in-sample. If ZEFR Rate is predictive of future goal scoring efficiency, it suggests that after half a year’s worth of games, if a team is having success on entries with that player on the ice, the team is likely to score goals at a solid clip with that player on the ice for the rest of the year.
In all three categories, ZEFR Rate fares better than the variables we consistently quote when discussing special teams. Likely because of the larger sample size involved in entry attempts, ZEFR Rate is the most effective metric at evaluating power plays we have so far.
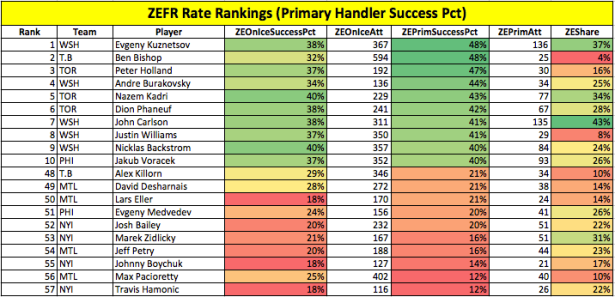
In examining the highest (top 10) and lowest (bottom 10) on-ice performers at this metric, we can see that what our eyes tell us is backed up in the numbers.
Note: The sample for all data includes every 5-on-4 power play of the 2015-2016 season for the Montreal Canadiens, New York Islanders, Washington Capitals, Philadelphia Flyers and Tampa Bay Lightning, as well as the first 54 games’ worth for the Toronto Maple Leafs.
While the top of the list is littered with Capitals, the second unit of the New York Islanders is particularly woeful, failing to accomplish either of our objectives more than 80 percent of the time they head up ice.
This data can also show which players account for the highest share of entry responsibility when they are on the ice. In determining ZE Share, I designated a player on each entry I felt was most responsible for the entry result. For entries in which a pass immediately preceded the entry, I credited the passer. In all other cases, it was the puck carrier who bore that responsibility. Here is the list of top 10 and bottom 10 tracked players in terms of ZE Share.
Primarily point men (or what we would call defensemen at even strength) predictably lead in this category, but it’s notable how important Evgeny Kuznetsov, Claude Giroux and P.A. Parenteau are to their respective teams in a zone entry role. While not displayed above, it’s also interesting that Alex Ovechkin just barely missed the cut as one of the least used zone entry handlers at 11 percent. Ovechkin is largely a decoy nowadays on the power play, and entries are no exception. By alleviating him of that responsibility, the team also keeps him fresher so that he is able to go the full two minutes. Maybe most importantly, for a team that wants to set up their offensive zone plays from the right side, having the puck enter the zone through Ovechkin on the left would kill valuable seconds. So he’s a secondary read for the puck carrier.
Finally, below are the best and worst performers in personal ZEFR Rate, or occasions in which the player in question bore primary entry responsibility.
You may have been surprised to see Ben Bishop creep into the bottom of the previous chart as a goalie with a 4 percent share. The reason he appears is that among goalies he alone exceeded my threshold for primary zone entry responsibility of 20 entries; Bishop is a master of the stretch pass.
Bishop led all qualifying players except Kuznetsov in personal ZEFR Rate, and his 12 successful entry passes were more than double what any other goalie I tracked registered (granted, only six teams-worth, and the next highest was Carey Price in limited game action, but even that tells you something). Bishop is a huge power play asset for the Tampa Bay Lightning.
You can see the full list of players in all three categories here.
Ultimately, this metric is only a small step towards better evaluating and predicting power play success, but it also suggests that in many organizations, coaches need to begin prioritizing different things on special teams. By thinking outside the box; looking to football as tactical inspiration; addressing practice habits, teachings, and overall strategy, and putting more emphasis on special teams role considerations in personnel decisions; maybe we will see a team eclipse the elusive 30 percent power play clip in the not too distant future. With metrics like ZEFR Rate, maybe we’ll even see it coming.


