Behind the Numbers: Where analytics and scouts get the draft wrong

Every once-in-a-while I will rant on the concepts and ideas behind what numbers suggest in a series called Behind the Numbers, as a tip of the hat to the website that brought me into hockey analytics: Behind the Net. My ramblings will look at the theory and philosophy behind analytics and their applications given what is already publicly known.

Hello everyone; I am back! I was in the process of writing an article on NHL prospect development for after the draft (teaser!) when a Twitter thread sparked my interest and made me want to do a bit of a ranty, very pseudo-Editorial or Literature Review on analytics and the draft while combing over that thread.

Continue reading

Wins Above Replacement: Replacement Level, Decisions, Results, and Final Remarks (Part 3)

In part 1 of this series we covered the history of WAR, discussed our philosophy, and laid out the goals of our WAR model. In part 2 we explained our entire modeling process. In part 3, we’re going to cover the theory of replacement level and the win conversion calculation and discuss decisions we made while constructing the model. Finally, we’ll explore some of the results and cover potential additions/improvements. 

Continue reading

Wins Above Replacement: The Process (Part 2)

In part 1, we covered WAR in hockey and baseball, discussed each field’s prior philosophies, and cemented the goals for our own WAR model. This part will be devoted to the process – how we assign value to players over multiple components to sum to a total value for any given player. We’ll cover the two main modeling aspects and how we adjust for overall team performance. Given our affinity for baseball’s philosophy and the overall influence it’s had on us, let’s first go back to baseball and look at how they do it, briefly.

Continue reading

Wins Above Replacement: History, Philosophy, and Objectives (Part 1)

Wins Above Replacement (WAR) is a metric created and developed by the sabermetric community in baseball over the last 30 years – there’s even room to date it back as far as 1982 where a system that resembled the method first appeared in Bill James’ Abstract from that year (per Baseball Prospectus and Tom Tango). The four major public models/systems in baseball define WAR as such:

  • “Wins Above Replacement (WAR) is an attempt by the sabermetric baseball community to summarize a player’s total contributions to their team in one statistic.” FanGraphs
  • “Wins Above Replacement Player [WARP] is Prospectus’ attempt at capturing a players’ total value.” Baseball Prospectus
  • ”The idea behind the WAR framework is that we want to know how much better a player is than a player that would typically be available to replace that player.” Baseball-Reference
  • “Wins Above Replacement (WAR) … aggregates the contributions of a player in each facet of the game: hitting, pitching, baserunning, and fielding.” openWAR

Continue reading

Revisiting Relative Shot Metrics – Part 2

In part 1, I described three “pen and paper” methods for evaluating players based on performance relative to their teammates. As I mentioned, there is some confusion around what differentiates the relative to team (Rel Team) and relative to teammate (Rel TM) methods (it also doesn’t help that we’re dealing with two metrics that have the same name save four letters). I thought it would be worthwhile to compare them in various ways. The following comparisons will help us explore how each one works, what each tells us, and how we can use them (or which we should use). Additionally, I’ll attempt to tie it all together as we look into some of the adjustments I covered at the end of part 1.

A quick note: WOWY is a unique approach, which limits it’s comparative potential in this regard. As a result, I won’t be evaluating/comparing the WOWY method further. However, we’ll dive into some WOWYs to explore the Rel TM metric a bit later.

Rel Team vs. Rel TM

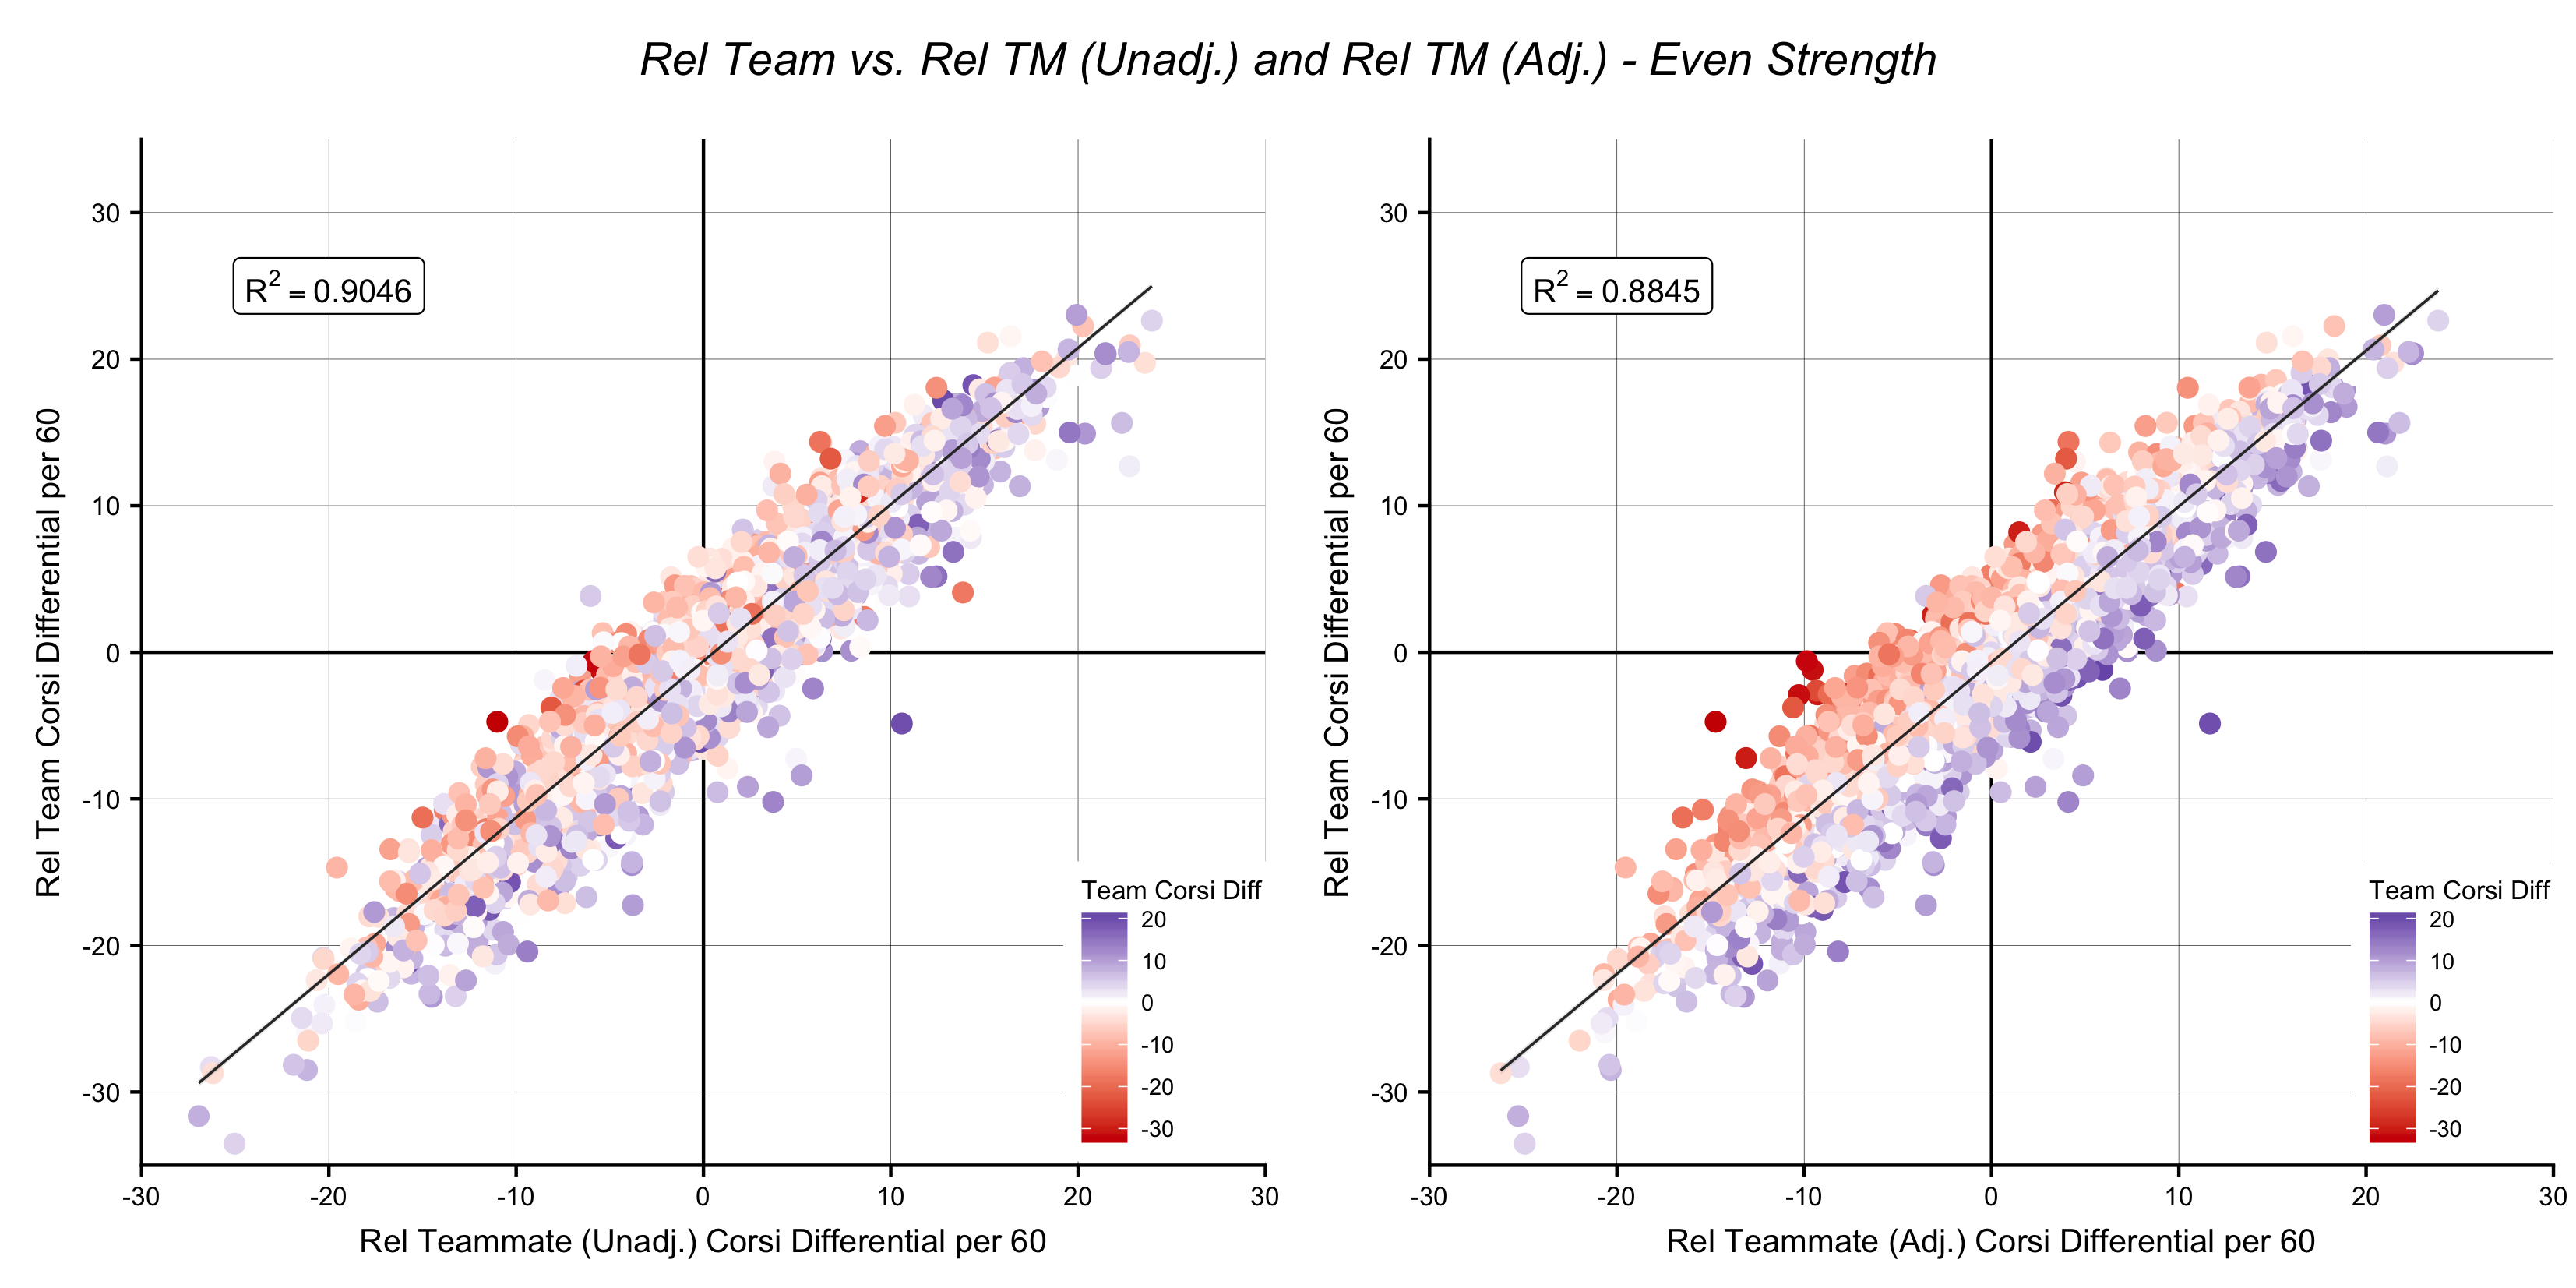
Note: For the rest of the article, the “low TOI” adjustment will be included in the Rel TM calculation. Additionally, “unadjusted” and “adjusted” will indicate if the team adjustment is implemented. All data used from here on is from the past ten seasons (’07-08 through ’16-17), is even-strength, and includes only qualified skaters (minimum of 336 minutes for Forwards and 429 minutes for Defensemen per season as estimated by the top 390 F and 210 D per season over this timeframe).

Below, I plotted Rel Team against both the adjusted and unadjusted Rel TM numbers. I have shaded the points based on each skater’s team’s EV Corsi differential in the games that skater played in:

relattive_cow_comp Continue reading

Revisiting Relative Shot Metrics – Part 1

Relative shot metrics have been around for years. I realized this past summer, however, that I didn’t really know what differentiated them, and attempting to implement or use a metric that you don’t fully understand can be problematic. They’ve been available pretty much anywhere you could find hockey numbers forever and have often been regarded as the “best” version of whatever metric they were used for to evaluate skaters (Corsi/Fenwick/Expected Goals). So I took it upon myself to gain a better understanding of what they are and how they work. In part 1, I’ll summarize the various types of relative shot metrics and show how each is calculated. I’ll be focusing on relative to team, WOWY (with or without you), and the relative to teammate methods.

A Brief Summary

All relative shot metrics whether it be WOWY, relative to team (Rel Team), or relative to teammate (Rel TM) are essentially trying to answer the same question: how well did any given player perform relative to that player’s teammates? Let’s briefly discuss the idea behind this question and why it was asked in the first place. Corsi, and its usual form of on-ice Corsi For % (abbreviated CF%) is easily the most recognizable statistic outside of the standard NHL provided boxscore metrics. A player’s on-ice CF% accounts for all shots taken and allowed (Corsi For / (Corsi For + Corsi Against)) when that player was on the ice (if you’re unfamiliar please check out this explainer from JenLC). While this may be useful for some cursory or high-level analysis, it does not account for a player’s team or a player’s teammates.

Continue reading

About that Flyers challenge last night…

Embed from Getty Images

Last night Dave Hakstol and the Flyers were the first team to get burned by the NHL’s new offside challenge rule. With a one-goal lead over Nashville and just 2:41 left in the 3rd period, Philadelphia was dinged for not one but two minor penalties at the same time. And on the ensuing 5-on-3 power play, Scott Hartnell banged in a loose puck to tie the game up.

https://www.nhl.com/video/embed/hartnells-late-game-tying-goal/t-290860626/c-53362803?autostart=false

Philly, however, decided there was something not quite right about Hartnell’s goal. They thought that Filip Forsberg may have snuck into the offensive zone just slightly ahead of the puck on the zone entry that preceded the tying marker. The Flyers decided to challenge, hoping that video review would negate the Preds’ goal and put them back on top with just under two minutes to play.

When news first came out of the league’s proposal to change the rules, there was a lot of skepticism that it would act as much of a deterrent to frivolous challenges. While no coach wants to see their team go on the penalty kill after conceding a goal, the odds were still stacked pretty heavily in favour of challenging even in low probability scenarios. In a normal even-strength situation, your probability of success doesn’t need to be all that high in order to make a challenge worthwhile, in fact you’re safe challenging a lot of the time with less than a 25% certainty of success.
Continue reading

How certain do you need to be on an offside challenge?

Offside challenges are, to say the least, a controversial topic. While many have advocated for the benefit of getting the call right even at the cost of a delay in the game, it’s almost indisputable that the introduction of the offside challenge has slowed down the flow of the game. Over the past two years, coaches have challenged any play that was remotely close with the hopes of getting lucky on the video review, to the dismay of basically anyone other than replay technicians.

Those spurious challenges are one reason why the NHL modified the rules around coach’s challenges yesterday. Starting next season, instead of a failed challenge simply resulting in the loss of a team’s timeout, clubs will now face a 2 minute penalty for losing an offside challenge. Upon hearing of this change many fans were apoplectic, complaining that this rule change could bury teams who were already reeling from giving up a goal against, and would severely limit the willingness of coaches to challenge even legitimate missed offside calls.

Fan reaction notwithstanding, however, the question coaches should be asking is whether they should be changing their approach in response to the new rules. The threat of killing off a penalty for a failed challenge may seem like a big deal, but it’s important to note that teams only score on roughly 20% of their power play opportunities. Fans will surely remember when a failed challenge leads to a power play goal against, but there will certainly be occasions when the potential gain from overturning your opponent’s goal outweighs the risk.

Continue reading

Introducing Weighted Points Above Replacement – Part 2

In part 1, I laid out the basis for Weighted Points Above Average (wPAA). Now it’s time to change the baseline from average to replacement level. A lot has been written about replacement level, but I’ll try to summarize: replacement level is the performance we would expect to see from a player a team could easily sign or call up to “replace” or fill a vacancy. In theory it is the lowest tier NHL player.

Continue reading

Introducing Weighted Points Above Replacement – Part 1

Aggregate statistics in sports have always fascinated me. I might go so far as to say my need to better understand how these metrics work is one of the reasons I became interested in sports statistics in the first place. I also feel the process of developing them raises an incredible number of important questions, especially with a sport like hockey. Rarely are these questions raised in a more succinct and blunt manner than when a new aggregate stat first emerges and people see how good Oscar Klefbom is.

These questions mainly focus on how to value, weight, and interpret the various metrics that are available. For instance, should we value primary points per 60 more than relative Corsi for/against? How much more? Is there a difference? What’s the difference? Should we use some sort of feeling or intuition to determine which stats we like best? How do we address the issue of different metrics being used in conjunction to evaluate players? There have been multiple attempts to “answer” these questions (and many others) in hockey – Tom Awad’s Goal Versus Threshold (GVT), Michael Schuckers and Jim Curro’s Total Hockey Rating (THoR), Hockey Reference’s Point Shares, War-On-Ice’s (A.C. Thomas and Sam Ventura) WAR/GAR model, Dom Galamini’s HERO Charts, Dom Luszczyszyn’s Game Score, and most recently Dawson Sprigings’ WAR/GAR model… (Emmanuel Perry is also in the process of constructing a WAR model that I’m very excited about).

Continue reading