NHL Scoring Trends, 2007-08 to 2017-18: Is the League Getting More Competitive?

Photo by Bobby Schultz, via Wikimedia Commons

Though it was completely tangential to @SteveBurtch’s line of thinking, his brief comments pondering the competitiveness between the middle of NHL lineups yesterday (which I can’t locate now, natch) got me thinking about whether the NHL and team management has gotten any more efficient or competitive overall the last decade. With 10 years in the books for complex Corsi data, and hockey’s seeming “Moneyball moment” fully here regardless of the quibbling on social and mainstream media, is the league getting any tighter?

Continue reading

Blue Jackets Coach Todd Richards’ Firing, & Why the History Doesn’t Agree With Mike Harrington

Photo by user

Photo by user “Arnold C,” via Wikimedia Commons; altered by author

The Columbus Blue Jackets made a bold move today, firing their coach of 3 1/2 seasons Todd Richards in favor of noted firebrand and Brandon Dubinsky fan John Tortorella. The move, riding the coattails of a 0-7 start for the Jackets, was done unusually early in the season, so unusually I decided to spill a little ink on it.

Around the same time I was rounding up the data, the esteemed (Buffalo Baseball Hall of Fame!) Sabres writer and analytics pot-shotter Mike Harrington decided now was the time to defend a decision that made little sense, about a team he doesn’t write about. It started with a reasonable tweet from Friend of the Blog Micah Blake McCurdy:

At which point Harrington followed:

Alright, Mike, let’s take a look at the “numbers that count,” according to you. There’s a fun history here.

Continue reading

Why I’m Supporting Micah Blake McCurdy’s Work at Hockey Viz

//platform.twitter.com/widgets.js

A couple days ago, Micah Blake McCurdy made his first step towards The Great Unknown. It’s a decision hanging on a number of questions we always ask ourselves in the analytics community: What is my work worth to me? What is my work worth to others? For as much time as my spend on it, how can I make sure my work means something, and my time rewarded? How do I make sure my work stays exactly that: mine?

For the past decade, a number of powerful minds have navigated The Great Unknown, finding that apprehensive teams were only willing to commit peanuts and, on rare occasions, real salaried work after a partnership of a couple years. What made The Great Unknown even more of a mystery was the disappearance of sites, and data, and “stats” groups peddling other people’s work (usually in poor or incorrect fashion), and the discovery by some stats analysts that teams had been tracking data in ways that were curious, tedious, unhelpful. When the so-called Summer of Analytics occurred, The Great Unknown had the curtain pulled back a little bit: we started knowing who was getting hired where. But that peek exposed the still-immense uncertainty of the work available with some teams, and opened a new area of intrigue: analytics writing.

So why is what Micah is doing so important?

Continue reading

Paul Bissonnette is Wrong and Right

Photo by Michael Wifall, via Wikimedia Commons; altered by author

Photo by Michael Wifall, via Wikimedia Commons; altered by author

From the outset, I want to say the Player’s Tribune, conceptually, is a wonderful thing. To have players guest post or answer questions without the emotions of a post-game presser or rigid formality of a journalist interview provides great insight to their personalities. And just like anybody we’d encounter in daily life, they say things we agree with, things we don’t agree with, or things we might’ve worded differently. Take, for instance, today’s “Mailbag” with Paul Bissonnette. A majority of the interview, which were questions from readers, were your general enforcer interview questions: best fight, worst fight, scary fight, do you like to fight, etc.

But then there was this final question, which I can only assume came from Mark Spector:

Bissonnette Players Tribune II

Bissonnette’s response, his longest of the interview, was chock full of wrong, with plenty of right on the side.

Continue reading

NHL Stanley Cup Finals Prediction: Fighting the Coin

File:Épreuve de 5 cents en laiton du Canada représentant George VI.jpg

Image by “cgb.fr” via Wikimedia Commons

Unfortunately, size couldn’t work forever…the Ducks’ failure to advance to the Stanley Cup Finals realized the 30% chance that none of our brackets correctly picked both series winners last round. My only conclusion is we don’t know anything about hockey.

In a related story, SAP bricked one of their picks as well, so the Finals will ultimately determine if their “85% accurate model” manages to do better than a coin flip this year (as of right now, they are 8 for 14). Let’s see how truculence, size, and experience did last round, where they stand for the playoffs, and which one of them will accurately predict who wins the Cup.

Continue reading

Why Possession and Zone Entries Matter: Two Quick Charts

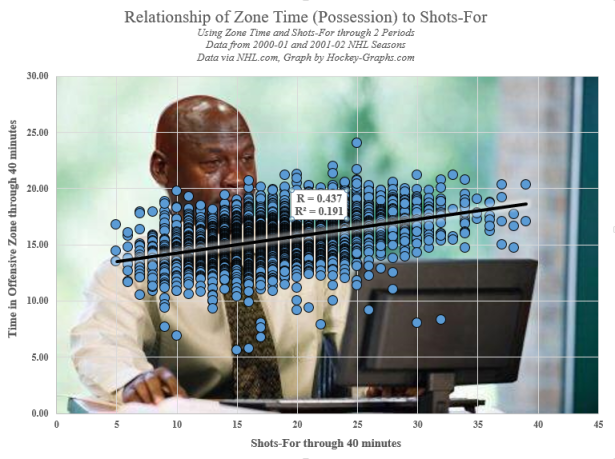
As some of you know, the NHL tracked offensive zone time for two seasons, 2000-01 and 2001-02, then inexplicably stopped. As some of you also know, I have a lot of historical game data, and that includes all the zone time from these seasons. Taking those performances, and focusing on the first two periods to avoid any major score effects (or “protecting the lead“), I charted every single game alongside 2pS%, the historical possession metric.

It’s pretty clear that the spread in shots-for in these games was quite a bit greater than the spread in zone times. Curious, I decided to do a distribution plot, the one that you see leading this piece (2pS% and offensive zone time % in the x-axis, percentage of total performances in the y-axis). Zone time, or generally speaking the flow of the game, has a tighter, much more normal distribution that the distribution of shots. What does this mean? This means that things like how you enter the zone (zone entries), and how you control the puck in the zone (possession, or passing) can make a pretty big difference in how you generate scoring opportunities.

Note: The data I used for these quick graphs were from home team’s perspective, hence why our distribution was a bit north of 50. Keeping that in mind, the 60-40 Rule we established here a year ago looks pretty good for assessing game flow, but there are ways within that flow that can tip the scale.

Sunday Quick Graph: Distribution of EA NHL Player Overall Ratings, from NHLPA Hockey ’93 to NHL 05

Out of curiosity, and having access to some of the data, I decided I could chart the distribution of player overall ratings in the EA NHL series in its first decade of existence (the first of the series and NHL 99 being the exception). Knowing full well that, by 2005, there was a popular gripe that “anybody could get a 70 overall rating,” it seemed like it would be fun to see how we arrived to that point. As you can see, the ’93 version was remarkable in its near-even distribution; most famously, Tampa Lightning defenseman Shawn Chambers received an overall rating of 1. The subsequent games never attempted a similar approach; there were marked divergences for the ’96 and ’04 versions, the latter essentially bringing us to the place where it seems anyone can get a 70 rating. I’d be interested hear your comments suggesting theories and/or evidence why we saw this kind of movement.

At this point I’m inclined to say, as an NHLPA-approved product, it probably wasn’t enjoyable for the players to have low ratings, and thus have that opinion of them reflected to thousands of young fans. More importantly, those fans probably didn’t get much of a kick out of playing with poorer players (playing against them, on the other hand…). I’d also guess that, when you are rating a player’s numerous attributes, it’s hard to end up with a 1 overall unless you had negative values (which they didn’t) or a very low weighting for multiple attributes (which they mostly didn’t).

Why would I even bother looking at this anyway? Well, for two reasons. One, after boxcar statistics (goals, assists, points) and +/-, video game ratings were really the next attempt to derive a publicly-consumed statistic for player talent and value. Whole generations observed, and potentially internalized, the way these games conceptualized important and unimportant elements of the game. Understanding hockey should be as much an understanding of society as it is an understanding of the technical components of the game.

Postscript: I plan on breaking down this data in a more complex fashion in future posts, so stay tuned…

Postscript II: Best theory I’ve seen so far, from Reddit user “DavidPuddy666” — that the inclusion of CHL and other leagues raised this bar. For the most part, though, I recall the international rosters and European leagues following these distributions. In other words, you didn’t have a bunch of sub-50 overalls buried on international rosters. The European leagues were even worse for this; top players in Euro leagues are still rated as if they would be top NHL players. As for the CHL leagues and the AHL, Puddy might have a point — but the AHL didn’t appear till NHL 08, and the CHL leagues till NHL 11. In fact, the international teams theory also has this chronological issue, as only the best international teams make their appearance first in NHL 97, before an additional 16 international teams are added for NHL 98.

2015 NHL Stanley Cup Conference Final Predictions: Maybe…Truculence, Size, & Experience Don’t Matter Much

Photo by

Photo by “Resolute” via Wikimedia Commons; altered by author

Another round in the books, so it’s time to re-assess truculence, size, and experience in our Stanley Cup Playoffs predictions and reload for the Conference Finals. SAP had a better-than-coin-flip 2nd round, getting 3 of 4 series right, and you’ll be disappointed to know that that pulls them ahead of our more-celebrated team “virtues.” For those interested after our previous post, Nicholas Emptage over at Puck Prediction nailed the 2nd round and his model improved to 10-2 these playoffs — Bravo.

Let’s see how everything broke down for us…

Continue reading

How Did Bucci Do? Revisiting John Buccigross’s Alex Ovechkin Goals Projection

Photo by

Photo by “Photonerd23” via Wikimedia Commons

In February of the 2009-10 season, John Buccigross of ESPN was spurred by a mailbag question to do a quick thought experiment: does he think Ovechkin could set the all-time goals mark? Gabe Desjardins voiced skepticism of Bucci’s optimistic projection but didn’t offer a counter-projection, presumably because, as he wrote:

Basically, careers are incredibly unpredictable – nobody plays 82 games a year from age 20 to age 40. And players who play at a very high level at a young age tend to not sustain that level of play until they’re 40…So, to answer the reader’s question: I believe that there is presently no significant likelihood that Alex Ovechkin finishes his career with 894 goals. He needs to display an uncommon level of durability for the next decade, and not just lead the league in goal-scoring, but do so by such a wide margin that he scores as much as Gretzky, Hull or Lemieux did in an era with vastly higher offensive levels.

That said, I thought it would be fun, with five full years gone, to see how Bucci did, and try to build a prediction model with the same data he had available. Continue reading