In part 1 of this series we covered the history of WAR, discussed our philosophy, and laid out the goals of our WAR model. In part 2 we explained our entire modeling process. In part 3, we’re going to cover the theory of replacement level and the win conversion calculation and discuss decisions we made while constructing the model. Finally, we’ll explore some of the results and cover potential additions/improvements.
Continue readingMonth: January 2019
NL Ice Data: A Swiss Hockey Analytics Website
In the last 10 years, I have been impressed by the development of the hockey analytics community in North America as well as the tools made available to the public in the hope of increasing the general hockey knowledge.
Unfortunately, in Switzerland, the Swiss Ice Hockey Federation (SIHF) does not provide the same level of information as there is in North America and keeps part of its proprietary data for itself. As such, fans and journalists, except on very rare occasions, don’t have access to the same kind of in-depth researches/analyses as there are in the NHL or some other European leagues. Plus/minus is still THE hockey statistic for some journalists or analysts.
The first part of my project with the Hockey-Graphs Mentorship program was to create a platform entirely dedicated to Swiss hockey statistics, called NL Ice Data, the main goal was to exploit as much as possible the available data and to give fans access to additional statistics the SIHF doesn’t necessarily provide:
- GF/GA: for players, RelGF%, GF/60, …;
- time on ice deployment and evolution;
- linemates information;
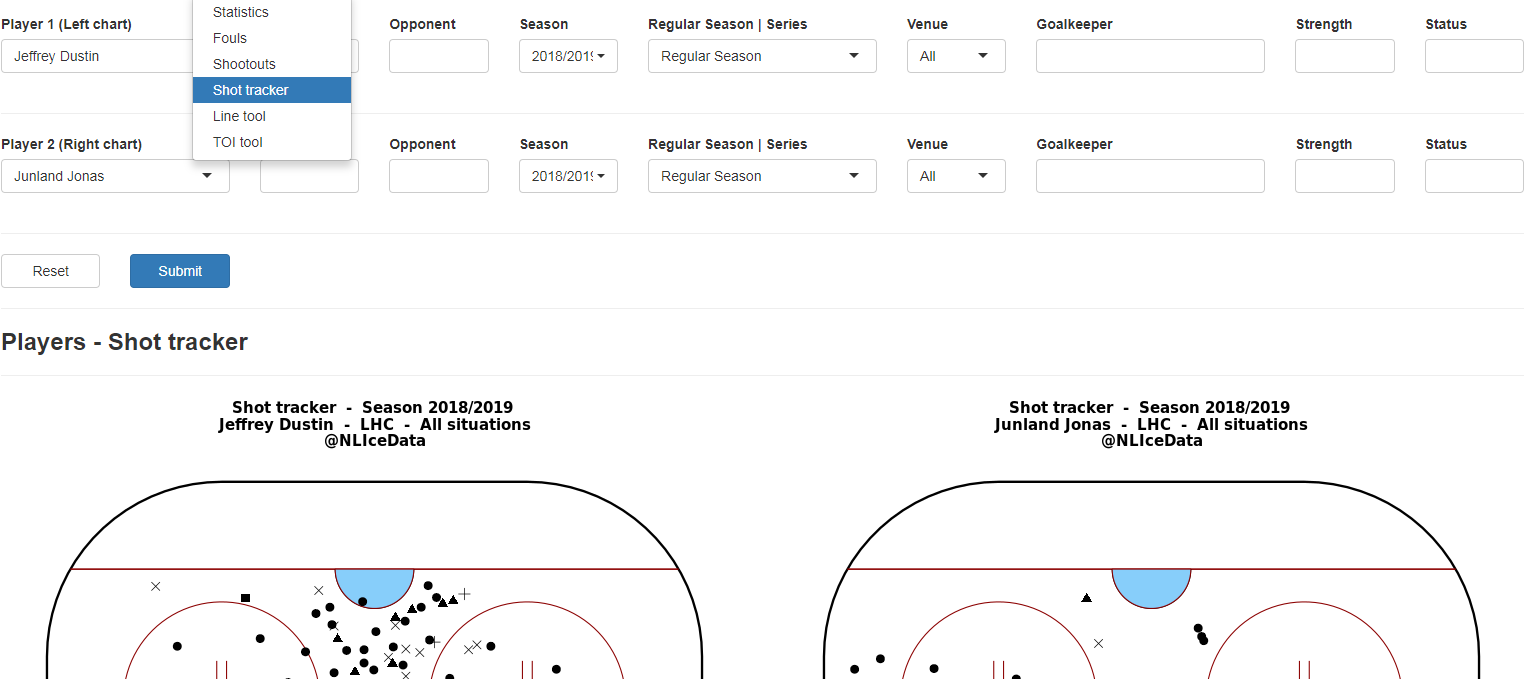
- aggregated shot tracker maps per player, goalie and team;
- and many others.
Current features include the same core of statistics for players, goalkeepers and teams: statistics, fouls, shootouts and shot tracker maps. Easy to use, the website provides interactive tables and charts so that fans can engage more with data. Additional features, charts and metrics will be added along the project.
By slowly integrating further metrics and concepts after the website’s launch (xG or Game Score for example), the modest goal is to build overall knowledge amongst fans. A secondary goal was to have a platform ready to publish more *advanced* statistics (including at the player level) as soon as the League publishes more of its proprietary data.
Wins Above Replacement: The Process (Part 2)
In part 1, we covered WAR in hockey and baseball, discussed each field’s prior philosophies, and cemented the goals for our own WAR model. This part will be devoted to the process – how we assign value to players over multiple components to sum to a total value for any given player. We’ll cover the two main modeling aspects and how we adjust for overall team performance. Given our affinity for baseball’s philosophy and the overall influence it’s had on us, let’s first go back to baseball and look at how they do it, briefly.
Continue readingWins Above Replacement: History, Philosophy, and Objectives (Part 1)
Wins Above Replacement (WAR) is a metric created and developed by the sabermetric community in baseball over the last 30 years – there’s even room to date it back as far as 1982 where a system that resembled the method first appeared in Bill James’ Abstract from that year (per Baseball Prospectus and Tom Tango). The four major public models/systems in baseball define WAR as such:
- “Wins Above Replacement (WAR) is an attempt by the sabermetric baseball community to summarize a player’s total contributions to their team in one statistic.” FanGraphs
- “Wins Above Replacement Player [WARP] is Prospectus’ attempt at capturing a players’ total value.” Baseball Prospectus
- ”The idea behind the WAR framework is that we want to know how much better a player is than a player that would typically be available to replace that player.” Baseball-Reference
- “Wins Above Replacement (WAR) … aggregates the contributions of a player in each facet of the game: hitting, pitching, baserunning, and fielding.” openWAR
Penalty Goals: An Expanded Approach to Measuring Penalties in the NHL
Intro
Penalty differential figures are a rather ambiguous concept in hockey. It seems only recently that the majority of analysts and fans have stopped touting a player’s total penalty minutes as a positive aspect of a player’s game. Let’s get one thing clear: taking penalties is a bad thing and drawing penalties is a good thing. When a penalty is taken or drawn, the change in strength state (5v5 to 5v4 for instance) directly impacts the rate of goal scoring for a given player’s team (goals for and goals against). We can measure this change by determining league average scoring rates at each strength state and can then determine the net goals that are lost/gained from a penalty that was taken/drawn. This was first shown in the penalty component of the WAR model from WAR-On-Ice (WOI) here. A.C. Thomas explains it:
Continue readingReviving Regularized Adjusted Plus-Minus for Hockey
Introduction
In this piece we will cover Adjusted Plus-Minus (APM) / Regularized Adjusted Plus-Minus (RAPM) as a method for evaluating skaters in the NHL. Some of you may be familiar with this process – both of these methods were developed for evaluating players in the NBA and have since been modified to do the same for skaters in the NHL. We first need to acknowledge the work of Brian Macdonald. He proposed how the NBA RAPM models could be applied for skater evaluation in hockey in three papers on the subject: paper 1, paper 2, and paper 3. We highly encourage you to read these papers as they were instrumental in our own development of the RAPM method.
While the APM/RAPM method is established in the NBA and to a much lesser extent the NHL, we feel (especially for hockey) revisiting the history, process, and implementation of the RAPM technique is overdue. This method has become the go-to public framework for evaluating a given player’s value within the NBA. There are multiple versions of the framework, which we can collectively call “regression analysis”, but APM was the original method developed. The goal of this type of analysis (APM/RAPM) is to isolate a given player’s contribution while on the ice independent of all factors that we can account for. Put simply, this allows us to better measure the individual performance of a given player in an environment where many factors can impact their raw results. We will start with the history of the technique, move on to a demonstration of how linear regression works for this purpose, and finally cover how we apply this to measuring skater performance in the NHL.
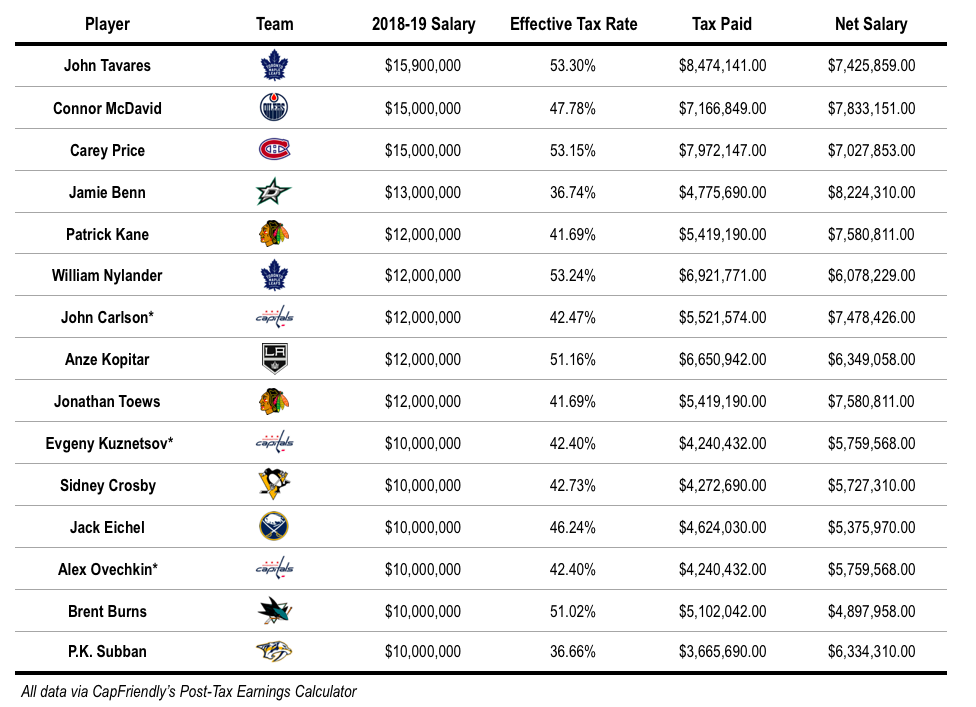
Continue readingHow Much Do NHL Players Really Make? Part 2: Taxes
Although published NHL salaries may seem exorbitant at times, players’ annual income is subject to a number of withholdings that limit their take-home pay. As we explained in Part 1 of this series, players lose some of their earnings to escrow – a reconciliation process arising out the Collective Bargaining Agreement between the league and the NHL Players’ Association. Another expense that reduces a player’s earnings is something that all workers in the United States and Canada are subject to: taxes.