
Recently, I showed how passing data is a better predictor of future player scoring than existing public metrics. In this piece, I’m going to show that by accounting for shot quality via passing metrics we can more accurately predict a team and player’s on-ice goal-scoring rates. I’m going to do this by quantifying the pre-shot movement that occurs when a player is on the ice. Finally, I’ll spend some time discussing certain forwards/teams that caught my eye. All data is from 5v5 situations and special thanks to Dr. McCurdy for pulling the on-ice player data for me. All non-passing project data is from Corsica.
Month: February 2017
Friday Quick Graphs: League Wide Report
Embed from Getty Images
The All-Star break is now in the past. The trade deadline is less than two weeks away. Teams across the NHL have a pretty good idea of who they are. They know their strengths and weaknesses. The possible outcomes for their seasons are narrowing. Some teams are already locked into playoff spots and only have to worry about positioning. Others will have to slowly accept the reality that this isn’t their year and consider how that impacts their approach at the deadline. This is a perfect time to take a high-level view of the league and look at each team using a series of simple metrics to help get a grasp on where all thirty teams are sitting.
Measuring the Importance of Structure on the Power Play
Embed from Getty Images
tl;dr
- We can measure a team’s power play structure using shot location data, creating a Power Play Structure Index that quantifies their ability to establish and shoot from a structured formation.
- A Team’s Power Play Structure Index is a stronger predictor of future goal scoring than past goals, but weaker than shot attempt generation.
- When examined together with shot attempt generation, power play structure is a significant predictor of future goals, although slightly less important than shot attempt generation.
- A team’s structure index can provide valuable additional insight into why certain power plays succeed or fail.
Edit 2017-02-15: An earlier version of this piece had a small error in the regression coefficient for PP Structure Index. While the article previously indicated the coefficient was -0.19, it should in fact be -0.30. The text both above and below has now been corrected.
Introduction
The importance of structure in a team’s power play is something that’s really easy to see. We’ve all watched a power play executing at the top of its game: the puck flies from player to player, leaving defenders pivoting in place to try to keep up. Each shot looks exactly like it was diagramed by the coach, with attackers working to set up a specific shot from a specific player in a specific location.
A solid structure doesn’t just look good; it actually produces better results. Arik Parnass has written extensively on the importance of structure to power play success, showing that teams who get set up in a dangerous formation score more goals than those who don’t.
There’s No Secret to Protecting a Lead
I was born into a family of Islander fans, so I never had a chance to avoid the sadness that comes with that fandom. While Islander fans are sad for a lot of reasons, one constant complaint over the past several years has been their inability to protect a lead.
However, this is not a unique complaint of Islander fans alone. Fans of other teams have similar gripes. For example, the Leafs have been criticized this season on the same grounds. And here’s fellow Hockey Graphs write Asmae when I suggested doing some research on blown leads:
So, are some teams particularly bad at holding leads? Asked another way, is keeping a lead a skill distinct from the rest of the team’s performance, or is it just a function of the team’s overall skill and luck?
FQG: Were Julien’s Bruins Gaming their Corsi?
Embed from Getty Images
This week, the long-speculated dismissal of Boston Bruins’ coach Claude Julien finally happened. After 759 games, 419 wins, a Stanley Cup, and a Jack Adams trophy over his almost 10-year run in Boston, Julien is a free agent coach, free to mull options like the Vegas Golden Knights, the New York Islanders, and a slew of other head coach positions that are almost certain to be offered to him as the season goes on.
Every coach gets fired sometime. Julien, great as he was, wouldn’t escape this fate either.
But the fallout since his dismissal has been intriguing. The Bruins led the NHL in adjusted Corsi for percentage under Julien this season but sunk to 28th in the in team shooting percentage and 24th in team save percentage this week.
How can we reconcile these contrasting stats?
Hockey Analytics Survey Results
Around the New Year, I put together a survey inspired by something the soccer analytics community did last year. Thom Lawrence put it together and it was very informative and cool to see. He’s also a good follow on twitter. This post will go over the results from nearly 500 responses.
Behind the Numbers: The issues with binning, QoC, and scoring chances

Every once-in-a-while I will rant on the concepts and ideas behind what numbers suggest in a series called Behind the Numbers, as a tip of the hat to the website that brought me into hockey analytics: Behind the Net.
Almost weekly, you will see a “quant” or “math” type complain about some of the binning going on (usually with Quality of Competition or scoring chances).
But the reason may not seem intuitive, so I’ll use scoring chances as an example and explain the issues with binning continuous data.
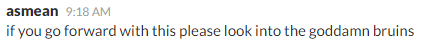
NWHL Shot Leaders
In anticipation of the NWHL All-Star Game (Feb 11-12), I wanted to look at which NWHL players contribute the highest % of their team’s shots on goal. This is simply the number of shots the player has taken, divided by the number of shots the player’s team has taken.
As the graph shows, Brianna Decker and Shiann Darkangelo lead the league in % of team shots at 19% each. Haley Skarupa, a rookie, leads the Conneticut Whale at 15% of the team’s shots. This is doubly impressive, as the Whale also lead the league in shots. Madison Packer leads the New York Riveters at 12%.
The code for this graph can be found on my Github page.
