NHL Scoring Trends, 2007-08 to 2017-18: Is the League Getting More Competitive?

Photo by Bobby Schultz, via Wikimedia Commons

Though it was completely tangential to @SteveBurtch’s line of thinking, his brief comments pondering the competitiveness between the middle of NHL lineups yesterday (which I can’t locate now, natch) got me thinking about whether the NHL and team management has gotten any more efficient or competitive overall the last decade. With 10 years in the books for complex Corsi data, and hockey’s seeming “Moneyball moment” fully here regardless of the quibbling on social and mainstream media, is the league getting any tighter?

Continue reading

Special Teams Analytics in the 21st Century

BestPPPredPlot1

Despite them accounting for approximately 20 percent of NHL game time, special teams have been largely ignored when it comes to analytics. Considering the data available and its small sample size compared to even-strength, that is somewhat understandable, and there have certainly been attempts to properly quantify and assess power plays. So what do we know so far? Continue reading

Expected Goals are a better predictor of future scoring than Corsi, Goals

newplot

This piece is co-authored between DTMAboutHeart and asmean.

Introduction

Expected goals models have been developed in a number of sports to better predict future performance. For sports like hockey and soccer where goals are inherently random and scarce, expected goals models proved to be particularly useful at predicting future scoring. This is because they take into account shot attempts, which are better predictors of a team and player’s performance than goal totals alone. 

A notable example is Brian Macdonald’s expected goals model dating back to 2012, which used shot differentials (Corsi, Fenwick) and other variables like faceoffs, zone starts and hits. Important developments have been made since then in regards to the predictive value of those variables, particularly those pertaining to shot quality.

Shot quality has been the subject of spirited debate despite evidence suggesting that it plays an important role in predicting goals. The evidence shows that shot characteristics like distance and angle can significantly influence the probability of a certain shot resulting in a goal. Previous attempts to account for shot quality in an expected goals model format have been conducted by Alan Ryder, see here and here

In Part I, an updated expected goals (xG) model will be presented that accounts for shot quality and a number of other variables. Part II will deal with testing the performance of xG against previous models like score-adjusted Corsi and goals percentage.

Continue reading

Paul Bissonnette is Wrong and Right

Photo by Michael Wifall, via Wikimedia Commons; altered by author

Photo by Michael Wifall, via Wikimedia Commons; altered by author

From the outset, I want to say the Player’s Tribune, conceptually, is a wonderful thing. To have players guest post or answer questions without the emotions of a post-game presser or rigid formality of a journalist interview provides great insight to their personalities. And just like anybody we’d encounter in daily life, they say things we agree with, things we don’t agree with, or things we might’ve worded differently. Take, for instance, today’s “Mailbag” with Paul Bissonnette. A majority of the interview, which were questions from readers, were your general enforcer interview questions: best fight, worst fight, scary fight, do you like to fight, etc.

But then there was this final question, which I can only assume came from Mark Spector:

Bissonnette Players Tribune II

Bissonnette’s response, his longest of the interview, was chock full of wrong, with plenty of right on the side.

Continue reading

Hockey Talk: Should players care about their advance statistics

A Caucasian ice hockey player wearing a white jersey with a blue and orange circular logo with the word
Jordan Eberle – Edmonton Oilers” by Lisa Gansky from New York, NY, USA – IMG_1468. Licensed under CC BY-SA 2.0 via Commons.

Hockey Talk is a (hopefully) weekly series where you will get to view the dialogue amongst a few of the Hockey-Graphs’ contributors on a particular subject, with some fun tangents.

This week we look at whether or not players should care about their advance statistics (with a tangent on talent distributions impact on hockey):

Continue reading

Why Possession and Zone Entries Matter: Two Quick Charts

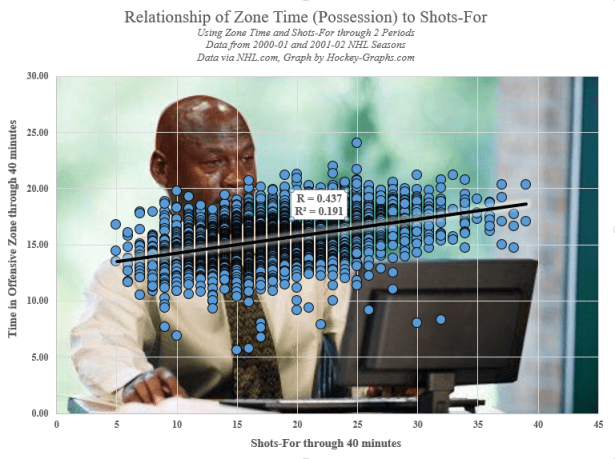
As some of you know, the NHL tracked offensive zone time for two seasons, 2000-01 and 2001-02, then inexplicably stopped. As some of you also know, I have a lot of historical game data, and that includes all the zone time from these seasons. Taking those performances, and focusing on the first two periods to avoid any major score effects (or “protecting the lead“), I charted every single game alongside 2pS%, the historical possession metric.

It’s pretty clear that the spread in shots-for in these games was quite a bit greater than the spread in zone times. Curious, I decided to do a distribution plot, the one that you see leading this piece (2pS% and offensive zone time % in the x-axis, percentage of total performances in the y-axis). Zone time, or generally speaking the flow of the game, has a tighter, much more normal distribution that the distribution of shots. What does this mean? This means that things like how you enter the zone (zone entries), and how you control the puck in the zone (possession, or passing) can make a pretty big difference in how you generate scoring opportunities.

Note: The data I used for these quick graphs were from home team’s perspective, hence why our distribution was a bit north of 50. Keeping that in mind, the 60-40 Rule we established here a year ago looks pretty good for assessing game flow, but there are ways within that flow that can tip the scale.

Will the 2015-16 Calgary Flames follow the 2014-2015 Colorado Avalanche?

Odds are, a team that performs like the 2014-2015 Calgary Flames in shots, possession, and chances will miss the playoffs. The odds also indicate if they do make it they are more likely going to be eliminated in the first round. Calgary beat the odds, though, and pushed into the second round until their eventual elimination at the hands of the Anaheim Ducks.

Odds are not destiny; out-shot teams make the playoffs all the time.

Just last season the 2013-2014 Colorado Avalanche finished the season with 112 points and were favorites to falter in the 2014-2015 season by the analytical community. This has led to comparisons between the 2014-15 Flames and the 2013-14 Avalanche.

How similar are the two teams? Let’s take a look.

Continue reading

The Pressures of Parity

File:Balanced scale of Justice (blue).svg

Two nights ago, when no one was looking, I tweeted out a telling statistic to understand how teams have reacted to the salary cap post-lockout.

Boulerice wasn’t the only one scraping the bottom of the barrel in 2005-06; Colton Orr was nearby with his 2:49 per game, and you didn’t have to look much further to see Andrew Peters (3:15) and Eric Godard (3:27). In fact, 19 skaters played over 20 games that season and recorded even-strength TOI/G lower than Peluso’s from this year. Teams have realized that, in a salary-capped league, even league-minimum dollars can’t justify players who cannot be trusted with regular minutes.

This was a fairly stark evolution of player usage, but it led me to wonder if there were any other things we could see by looking at finer-grained data from 2005-06 to the present. The salary cap was a game-changer because it pushed teams at the top and bottom closer together, and that compelled teams to stop employing players they couldn’t trust at evens; what are some other areas we see the pressure of parity?

Continue reading

The NHL Playoffs and Penalties

Image courtesy of WikiMedia

Not long ago, we researched hit and face off differentials and their relationship with playoff performance, in both the same statistic and in goal performance.

As a fan of the Winnipeg Jets, who lead the league for worst penalty differential for much of the season, I find it a very interesting topic to research. More power plays and less penalty kills means a better team goal differential over the course of a season, by a significant amount.

Let’s take a look after the jump.

Continue reading