

“Alex Ovechkin2” by Keith Allison. Licensed under Public Domain via Commons.
I don’t know if we’ll ever see a power play quite like that of this decade’s Washington Capitals. We can’t attach a firm date to it because it could extend as far as the end of Alex Ovechkin’s career at this rate, but we know that its peak of power began with the hiring of Adam Oates as Caps head coach back in 2012. Oates had run a successful 1-3-1 power play for the New Jersey Devils with Ilya Kovalchuk as his trigger-man, but nothing even close to the heights he managed to achieve with the man advantage in his two seasons in DC. Barry Trotz, to his credit, has kept the same formation — what’s that old adage about things that ain’t broke? — with only minor tweaks, and last year the power play continued to succeed.
Now there’s a lot to discuss about the formation and its success — I like to think of the Caps’ PP as a work of art more than anything else — but for the sake of this post I’m going to focus in on Alex Ovechkin. Never has there been a more criticized future first-ballot Hall of Famer, nor arguably a more controversial elite goal scorer. It should already be a given that Ovechkin is the best power play goal scorer of all time — he sits fifth overall in PPG/g despite playing in a significantly lower scoring era than his contemporaries like Mike Bossy and Mario Lemieux — but I would argue by the time he retires, he will also likely be the greatest goal scorer of all time period. It’s the man advantage recently, in the latter stages of Ovechkin’s goal scoring peak, that has been the sniper’s bread and butter. Since Oates brought the 1-3-1 to town, Ovi has scored 48% of his goals on the power play, compared to 33% prior to that. He scored 25 power play goals last year, six ahead of the next highest total in Joe Pavelski’s 19. You have to go back another five to reach the player who is in third — Claude Giroux with 14 — indicating how great of a season the Sharks’ center/winger had, but that’s a story for another day.
Let’s look at a couple of charts to visualize Ovechkin’s performance on the power play last season.
(Note: Power Play for this post refers to all game situations with his team up one goal, including 5-on-4, 4-on-3 and 6-on-5.)


These plots both represent all of the shot attempts Ovechkin had on the power play last season, thanks to War-On-Ice’s adjusted x,y shot location data. On the left, each dot represents a shot attempt, colored by the type of shot. On the right, you see a heat chart of shot attempt locations, with the lightest blue indicating the most shots. As we already know, Ovechkin likes to position himself on the left half-wall in the 1-3-1, allowing him to take shots (169 in total) closer to the center of the ice on his off-side, cranking one-timers at crazy speeds towards the opposing goalie. What might be somewhat surprising is that he took a fair number of shots on the right side as well (117) last season. My suspicion is that those were largely off the rush, because the Caps’ fairly structured PP generally doesn’t see Ovi rotate to the right side once the team has set up in the zone. A few of those were likely also off of face-off plays. What the charts above don’t show is which of those shot attempts were converted into goals. Coloring our shot plot by result of the shot presents an interesting conclusion.

While Ovechkin takes a huge number of shots from both the right and left on the power play, he only really scores from one side. According to the location data, 24 of Ovi’s 25 power play goals from last season were scored from the left side of the ice, essentially from the “Ovi Spot.” In fact, when I re-watched all 25 of those goals, I couldn’t find a single one that was from the right side of the ice. So that ratio may in fact have been 25:0. If you put that into Corsi shooting percentages, Ovechkin shot 14.2% from the left side on the power play last season, and only 0.8% from the right side. That first number is insanely high, and the second incomprehensibly low. The league average power play Corsi shooting percentage last year was approximately 6.7%. It’s not hard, watching him play, to figure out how Ovechkin is able to maintain a high shooting percentage on the left, but one would have to delve a little deeper to uncover the reason as to why he can’t score from the right. Either way, Ovechkin’s split in success rates by side is striking, and it is in no way representative of a league-wide split. The average Corsi shooting percentage from the left since the lost season on the power play is 6.71%, compared to 6.30% from the right. And last season alone, the percentages were flipped, with players cashing in on 6.47% of attempts from the left and 6.81% on the right. Similar raw numbers of attempts and goals as well. But where does Ovechkin rank among top power play producers in terms of this split. I created a subset of players who attempted at least 40 power play shots last year (a low threshold, but one that at least filters out some of the primary outliers), and sorted them by percentage of those attempts taken from the left side of the ice. That left 206 players, and here are the top 20 from each side.

Ovechkin’s shot split actually isn’t particularly high compared to other righties playing their off-sides, like Vancouver’s Radim Vrbata and Edmonton’s David Perron. On the flip side, it’s clear that Arizona’s Oliver Ekman-Larsson likes taking one-timers from the right, piling up the shots there, and likely getting less off the rush than an Ovechkin would to balance things out. What about goal splits? I took a similar subset, this time of players (100 in total) with at least 5 power play goals in 2014-2015.
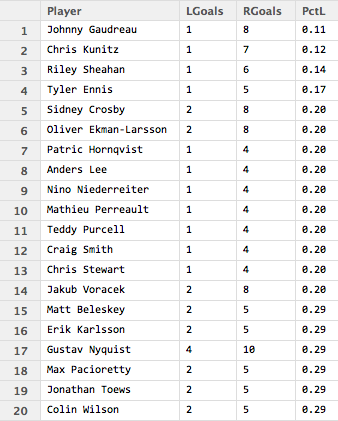
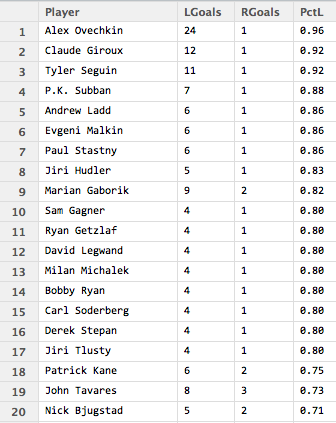
Here’s it’s obvious that Ovechkin is more effective when the Capitals are able to set up in the 1-3-1 with Ovechkin on the left. Claude Giroux is the beneficiary of a similar formation in Philadelphia, as is Sidney Crosby from the opposite wing in Pittsburgh. Sid may be a playmaker, but he gets his fair share of goals from the right circle as well. Finally, let’s look at shooting percentage differentials. Is Ovechkin’s success ratio from the left relative to the right the highest in the league? This time the subset was of players that met both thresholds, which turned out to be 90 in total.

For some, it seems likely that variance played a huge role in the difference between shooting success from the left and from the right. But for others, there may be a pattern here. Giroux, Ovechkin, Seguin and Gaudreau catch my eye immediately as players that seem to have success when set up in their teams’ respective formations, but may not have as much success shooting on the power play outside of that structure, likely on the rush. The takeway? Well other than simply appreciating Ovechkin’s volume and efficiency from the left side, one might suggest that the Caps’ primary sniper should avoid wasting shots when he’s not sitting in his usual spot, waiting for the one-timer and blasting it past whatever unfortunate keeper attempts to get in his way.
