Why The Hockey News’ Ken Campbell is Wrong About Alex Ovechkin

File:Defense.gov photo essay 080220-F-6684S-642.jpg

Photo by Adam M. Stump via Wikimedia Commons

You know, there was a time when I relished The Hockey News, and really any hockey writing I could get my hands on. I grew up in the sticks in Wisconsin, where you can’t find jack about hockey, and so to convince your parents to buy a THN magazine was a real treat. I’ve never forgotten that feeling, and I want those old reporting institutions to continue, but it isn’t going to happen with haphazard attempts at analysis like Ken Campbell’s piece on Ovechkin from today. In it, he tries to argue that Ovechkin is going to have the worst 50-goal season in NHL history because his plus-minus isn’t good. After the jump, let’s take a look at some of these gems.

Continue reading

Friday Quick Graph: Season Stories Using % of Team Shots, Gretzky, Lemieux, Sheppard, and Simpson in 1987-88

This takes the progressive, cumulative percentage of team shots from the graphs below and compares them to one another (to view the original charts: Simpson, Sheppard, Lemieux, Gretzky). It really establishes how greatly Lemieux mattered to the Penguins…Gretzky had plenty of teammates taking over the shots, especially as he was dinged up during the season and players like Messier and Kurri were helping carry the load (not to mention Simpson and his 43 goals in 59 games). Any surprise Lemieux was one season away from 85 goals and nearly 200 points? Any surprise Simpson was already coming down from what would prove to be a career year? Any surprise that Sheppard was moving towards a quality career? These %TSh charts can really lend to interesting seasonal and career narratives.

Part of the reason I like doing graph work is because a good graph (with a little bit of contextual knowledge) can tell a really interesting story. In the past, I’ve been a proponent of digging deeper into the historical data, and noted that even though we have less data of the pre-BTN era it doesn’t mean we can’t make some intriguing graphs. %TSh, or % of team shots (in the games a player participated), provides a great opportunity to do just that, not just in a player’s career (as I’ve done before) but also over the course of a season. In the graph above, I took two well-known players, Mario Lemieux and Wayne Gretzky, and matched them to two (to the younger readers) lesser-known players from 1987-88, Ray Sheppard and Craig Simpson; I expressed their %TSh cumulatively, game-by-game. Craig Simpson, at the tender age of 20, was having the best year of his career (56 goals on an incredible 31.6% shooting percentage), but a trade to the Oilers mid-season would alter his offensive role for that season and into the future. Ray Sheppard, like Simpson very young (21), over the course of the season earned Ted Sator’s trust and responded with a 38-goal rookie season. Sheppard would go on to be a very good offensive player for about a decade.

Yet their lines relative to Gretzky and Lemieux also remind us that, for as good as they were, neither were driving the boat to the level of those legends (and probably wouldn’t). So you do get some perspective on what some of the best-of-the-best were doing. Lemieux, who was entering his prime, was literally carrying a middling Penguins team on his shoulders, and his ability to do that would bring him, in 1988-89, to convince people that Dan Quinn and Rob Brown were really good.

For frame of reference, in the BTN Era (2007-08 to present) only Ovechkin has been able to come close to the kind of shot volume Lemieux was demonstrating in 1987-88.

NHL Systems, NHL History, and Forward vs. Defense Shooting

Photo by “ravenswing” via Wikimedia Commons

“It’s a matter of systems,” “They don’t have a good system,” “There is no system there”…we hear phrases much like this frequently, and I wonder just how much weight we give the word “system” in a game that flows and relies on instinct and reflex. Teams have some kind of system, no doubt, but it’s funny how the actions of any kind of system pale in comparison to the number of times we notice the classic breakout, setting up of the zone, or cycle. What I’m trying to say is, might we be putting too much emphasis on system, when the results are not clearly resulting in different shot quality? Might we be overstating the role of something practiced for a couple of months, maybe a year or two, versus 15-30 years of playing experience, and all the instincts, common tactics, and reflexes?

In my mind, systems are important in-and-of themselves, because their organization principles are intuitive. Cover the man or take away the passing lanes, apply forecheck pressure or trap in the neutral zone…these base ideas probably need to be there to keep things from devolving into pickup hockey. And you all know that game, where everyone’s a superstar forward and nobody backchecks. Seriously, no wonder you guys can’t ever find two goalies.

Anyway, with my current treasure trove of game-by-game, player-by-player data going back to 1987-88 (thanks to Hockey Reference’s excellent Play Index), I wanted to see just how much the game has evolved since the late 1980s, particularly in regards to defensemen involvement in the offense. We already know that the difference in shots-for per team, per game is 30.4 in 1987-88 to 29.1, so not a heck of a lot has changed in shot generation, and the goals/game per team has changed drastically, from 3.71 in ’87-’88 to 2.75 today. This information alone should suggest we probably haven’t improved too much in regards to what we might call offensive systems. Has defensemen involvement increased, and driven the scoring down? Have teams attempted more forward involvement to improve scoring? Will Guy Boucher ever convince us he has the key to better offense again?

I took data from about 30,000 individual player performances in 1987-88 and about 26,000 in 2012-13; I compared the player’s shot totals to their team totals in those games and derived my %TSh, or percentage of team shots metric, previously used in my piece on Career Charting.

Continue reading

The Skill of Avoiding Hits


The Elusive Austrian is a species that is apparently incredibly hard to hit on an NHL rink.

One of the most derided statistics tracked by the NHL is the “hit.” This is for good reason – outhitting the opposition generally has no correlation to winning hockey games, what correlation it has at all is basically negative (more hits = less winning, mainly due to more hits meaning you have the puck less), and of course, home trackers are known to massively over-count hits for home teams, with certain rinks being particularly bad.

But what about guys getting hit and avoiding getting hit? Just like Penalties, every play-by-play chart for each NHL game includes both the player doing the hitting and the guy who is being hit (like penalties taken and drawn). Extraskater now actually compiles hits against and hits +/- using these #s. Do these numbers mean anything?

Let’s see if we can answer 4 questions:
1.  Is avoiding getting hit a repeatable skill?
2. Is there a relationship between avoiding getting hit with increased scoring?
3. Is there a relationship between avoiding getting hit and winning the possession battle?
4. Do star players get hit more without an enforcer on the team?
Continue reading

Friday Quick Graph: Possessing the Puck in 1969, 1981, and 2013

Hextall OnIce.jpg

Photo by Jim Tyron, via Wikimedia Commons

Just finished tracking possession times in a November 15th, 1969 game between the Flyers and the Leafs. This game, when compared to the games from this post, fits virtually in-between them, which is interesting because, unlike with the other two games, the Flyers and Leafs were two teams on the lower end of the spectrum in the league (8th and 9th in 2pS% in a 12-team NHL). Maybe that also contributes to their average possession time of 6.08 sec (n=349) compared to the 1981 game’s 6.15 (n=364) and 2013 game’s 6.17 (n=360). Another observation among these games: the standard deviation for the 1969 and 1981 games is right around 4 seconds, where it’s right at 5 seconds for the 2013 game. I’ll save any deeper ruminations until I have a larger sample, but it’s food for thought.

Not too long ago, I decided I wanted to try out tracking time of possession in historical games, with the hope of eventually having enough data to look into things. I realized it’s going to be a little difficult to get large enough samples of singular teams, but I also realized that we could potentially compare the game as a whole in different eras. I’ve always been of the mind that the game has evolved somewhat, but at its core there are a number of best practices that have kept it pretty much the same game from around the time that the red line was introduced in 1943. I wanted to test that as far back as I could go, though, so with this possession tracking I actually tracked each individual possession rather than just a total time of possession. For this chart, I displayed all those individual possessions as a distribution, longest possessions to the shortest. These three games, the Philadelphia Flyers vs. Toronto Maple Leafs in 1969 (Toronto won 4-2), Edmonton Oilers vs. Philadelphia Flyers in 1981 (Edmonton won 7-5), and Los Angeles Kings vs. St. Louis Blues (St. Louis won 4-2), had some surprising results when compared. As you can see above, the distribution is actually quite close, with the 1981 game seeming to have shorter possessions but then moving above the others in the middle of the line. The 1969 game actually seems like a trendline of the 2013 and 1981 games. The average possession time? 1969: 6.08 seconds, 1981: 6.15 seconds, and 2013: 6.17 seconds. Obviously, I need (and want) more data, but it is a really intriguing start.

The “possession battle” results?

All Situations Possession

  • PHI (47.1%) vs. TOR (52.9%), 1969
  • EDM (53.4%) vs. PHI (46.6%), 1981
  • LAK (51.7%) vs. STL (48.3%), 2013

Possession, Score Close

  • PHI (41.3%) vs. TOR (58.7%)
  • EDM (48.7%) vs. PHI (51.3%)
  • LAK (51.2%) vs. STL (48.8%)

A Rule of 60-40: Thoughts on Individual Player Possession Metrics

Image

The image above is the distribution of individual offensive zone start percentage (or the percentage of times a player started their shift in the offensive zone) and the distribution of individual Fenwick percentages (shots-for and shots-missed for that player’s team divided by all shots-for and shots-missed, both teams, all tabulated when that player is on the ice). I specifically targeted player season performances wherein the player participated in at least 20 or more games, as that’s roughly around the number of games it takes before these measures start to settle down.

These distributions tell us a few important things for understanding possession, deployment, and how we might analyze the game. Most importantly, after the jump I have a modest proposal, a 60-40 Rule, that might help us in the chase for those elusive, all-encompassing player value metrics.

Continue reading

A Nice Tool to Have: BehindtheNet.ca Player Name Converter, plus Age and Position, 07-08 through 13-14

Those of you who have worked with Behind the Net data would be the first to say it’s a great, important site. I feel the same way, but I also know that anybody that’s worked with it close enough knows that there is a bit of a pain-in-the-ass there, with the different name spellings. Also, there are some position discrepancies and, for those that like to look into that sort of thing, player ages aren’t on there. Well, because I just brought the data together for something else I’m working on, I decided to share what I had for those problems. This link is to a Google doc that has the Season, regular Player Name, their age and position that season, and their BTN name for that season.

The players include all players that played a season from 2007-08 up to last week Thursday, 2013-14. Let me know if the link below doesn’t work:

BehindtheNet.ca Player Name Converter, plus Age and Position, 2007-08 through 2013-14

Hope this helps, happy researching!

Save Percentage vs the Experts: Round one, introduction of concepts

Photo Cred: Eric Hartline-USA TODAY Sports

Due to starting my dive into hockey statistics as a Winnipeg Jets fan, save percentage has always been a pretty big interest of mine, specifically in what it can and can’t tell us. The truth is, it is still a pretty rudimentary statistic and likely will be improved upon in the future. However, simple does not always mean bad or useless.

Of the three most common “goaltender statistics”, save percentage is the one controlled most by goaltenders. How can I be so sure of that? Well it can be provided with simple logic.
Continue reading

Friday Quick Graphs: Toronto Maple Leafs, Chicago Blackhawks, Edmonton Oilers, and Boston Bruins Shot Distributions, 5 Years

What you see above are the even-strength shots-for locations for the near-indisputable top team of the last five seasons (Chicago Blackhawks) versus the near-indisputable worst team of the last five seasons. This is a sort of visual anti-shot quality argument, a demonstration of why, across these five seasons, the indisputable #1 team would shoot 9.9% while the indisputable #30 team would shoot 9.6%. Notice the horseshoe design, about where defensemen normally sit, then jump up into the play. Notice the dense cluster around the high slot. All teams make these plays, try to make them, the difference being some are better at possessing and moving the puck to make the shot. What’s the primary difference above? The amount of shots.

None of the above charting is possible without Greg Sinclair’s awesome site, Super Shot Search. Bookmark it, use it, love it.

Oh, hey, what if I was to look at the teams with the best and worst save percentage these last five years? Would they look different in even-strength shots-against? Well, let’s see, Toronto and Boston:

There is a difference here, I think. I mean, the initial difference are the numbers, Boston’s SV% (92.1%) versus Toronto’s (89.5%). Another difference is it seems the two charts maintain roughly the same shot distributions, but flip ends of the rink. Not much to dwell on there. One thing I will say, that could relate to the SV% discrepancy, is that it doesn’t appear that Toronto records many, if any, shots from right along the boards. Now, I don’t know if this is a recorder’s error or not; it seems to me it’s pretty hard to get a shot from right tight along the boards. Maybe one recorder does it based on where the body of the skater was located, I don’t know. Or…Toronto does allow shooters to come in a little tighter, and Boston owns the center ice a bit better. Could that explain a near-3% discrepancy? I don’t think so; we know Toronto’s had worse goaltending. But it might’ve “helped.”

On Guys Who Score But Don’t Drive Possession

This dude didn’t drive possession much, but MAN what a shot.

Consider four types of forwards:

1.  Forwards who don’t drive possession and don’t score points
2.  Forwards who drive possession forward and score points effectively
3.  Forwards who drive possession forward but don’t score points
4.  Forwards who don’t drive possession but score points.

The first two types of forwards are easy to think about: Type 1 forwards are bad players, not really giving value through their play and Type 2 forwards are the best type of players, those who provide value in both offense and defense and aren’t a liability if they ever go on a cold streak.

Type 3 forwards are a little trickier, but really aren’t that hard to think about – they’re your ideal 4th and maybe 3rd liner, the guy who might not score but keeps your team in the game while your better guys rest.

Then you have your type 4 forwards – the dudes who can score a bunch of points but really don’t keep the puck out of your own zone and in the opponent’s zone.  Perhaps these guys are really bad defensively, perhaps they’re completely inept in the neutral zone, or perhaps they’re guys who score mainly by being in front of the net at the right time, and thus aren’t really being helpful when the puck doesn’t come to them.

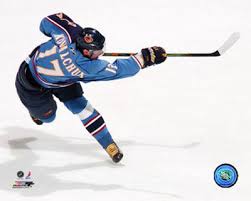
How do we value these guys?  Depending upon the point totals these guys can put up, we can value them pretty high actually.  Ilya Kovalchuk was a pretty damn good player who didn’t drive possession much, but his scoring almost certainly made up for what he cost the team otherwise.  Matt Moulson’s hands allowed John Tavares to rack up assists due to his amazing ability to be in the right position to put in goals.  Thomas Vanek likewise.

In a sense, these guys are basically role players.  Of course, that role isn’t being a grinder or a checker or some other name for defensive forward, it’s to be an offensive specialist, paying little attention to anything else.  You’d like to play these guys in positions that maximize that ability like any other role player – so high ozone starts, alongside guys who might complement those skills (playing them alongside guys who don’t have these weaknesses, and thus can make their line a plus possession line, is another typical way to handle these guys).  And scoring lots of points is a pretty important type of role for a player to have.

Most of the time, the best scorers don’t fall into this category – the skills involved with being a plus possession player are the same ones that lead to scoring goals – getting the puck into the zone by carry-in, spending more time in the O Zone, etc.  But a few guys will – think Ilya Kovalchuk or perhaps even the more recent version of Alex Ovechkin (though he used to be a clear driver of play).  These are guys you play as much as possible despite the possession problems simply because well – scoring is what wins games in the NHL.  These guys aren’t that common, so you’ll never see a low possession team dominate for multiple seasons like you did in the 80s (when three teams did accumulate such players).  But you play them anyhow and you try and surround them with a lot of plus possession talent to make up for their shortcomings.

Again, these players aren’t bad by any means – they can even be elite!  Of course, lacking possession driving skills means slumps by these guys will kill you, but for your Kovalchuk’s and Ovechkins, you’ll live with that.