

Photo by “ravenswing” via Wikimedia Commons
“It’s a matter of systems,” “They don’t have a good system,” “There is no system there”…we hear phrases much like this frequently, and I wonder just how much weight we give the word “system” in a game that flows and relies on instinct and reflex. Teams have some kind of system, no doubt, but it’s funny how the actions of any kind of system pale in comparison to the number of times we notice the classic breakout, setting up of the zone, or cycle. What I’m trying to say is, might we be putting too much emphasis on system, when the results are not clearly resulting in different shot quality? Might we be overstating the role of something practiced for a couple of months, maybe a year or two, versus 15-30 years of playing experience, and all the instincts, common tactics, and reflexes?
In my mind, systems are important in-and-of themselves, because their organization principles are intuitive. Cover the man or take away the passing lanes, apply forecheck pressure or trap in the neutral zone…these base ideas probably need to be there to keep things from devolving into pickup hockey. And you all know that game, where everyone’s a superstar forward and nobody backchecks. Seriously, no wonder you guys can’t ever find two goalies.
Anyway, with my current treasure trove of game-by-game, player-by-player data going back to 1987-88 (thanks to Hockey Reference’s excellent Play Index), I wanted to see just how much the game has evolved since the late 1980s, particularly in regards to defensemen involvement in the offense. We already know that the difference in shots-for per team, per game is 30.4 in 1987-88 to 29.1, so not a heck of a lot has changed in shot generation, and the goals/game per team has changed drastically, from 3.71 in ’87-’88 to 2.75 today. This information alone should suggest we probably haven’t improved too much in regards to what we might call offensive systems. Has defensemen involvement increased, and driven the scoring down? Have teams attempted more forward involvement to improve scoring? Will Guy Boucher ever convince us he has the key to better offense again?
I took data from about 30,000 individual player performances in 1987-88 and about 26,000 in 2012-13; I compared the player’s shot totals to their team totals in those games and derived my %TSh, or percentage of team shots metric, previously used in my piece on Career Charting.
First, some fun stat tidbits from the data. The average forward from the complete 56,000 player performance sample took 6% of his team’s shots; the average defenseman took 4.7%. The average age of a player playing a game in 1987-88 was 25.8 years, and 27.9 in 2012-13. Understandably, in both years about 2/3 of the performances were by forwards, and 1/3 by defensemen. The top individual performances in 1987-88 were:
| Forward | ||||||
| Player | Team | Date | Sh | Team Sh | %TSh | Stat Line |
| Gerard Gallant | DET | 10/12/1987 | 8 | 19 | 42.1 | 2G, 0A |
| Stephane Richer | MTL | 11/30/1987 | 10 | 25 | 40.0 | 2G, 1A |
| Glenn Anderson | EDM | 3/4/1988 | 12 | 30 | 40.0 | 4G, 0A |
| Mario Lemieux | PIT | 1/10/1988 | 8 | 21 | 38.1 | 4G, 0A |
| Brian Bellows | MIN | 12/18/1987 | 8 | 22 | 36.4 | 2G, 1A |
| Defense | ||||||
| Player | Team | Date | Sh | Team Sh | %TSh | Stat Line |
| Al MacInnis | CGY | 12/9/1987 | 9 | 28 | 32.1 | 0G, 0A |
| Ray Bourque | BOS | 12/8/1987 | 7 | 23 | 30.4 | 0G, 0A |
| Rick Green | MTL | 2/15/1988 | 7 | 23 | 30.4 | 1G, 0A |
| Paul Coffey | PIT | 2/4/1988 | 9 | 31 | 29.0 | 0G, 0A |
| Tom Kurvers | NJD | 2/5/1988 | 9 | 31 | 29.0 | 0G, 0A |
It’s pretty interesting that the forwards turned in such nice stat lines, yet the defensemen didn’t get jack. You also have to love Tom Kurvers making an appearance, Kurvers often (and perhaps unfairly) considered one of the more heartbreaking Maple Leafs acquisitions because he cost the draft pick that became Scott Niedermayer. And as for the top performances in 2012-13:
| Forward | ||||||
| Player | Team | Date | Sh | Team Sh | %TSh | Stat Line |
| Evander Kane | WPG | 3/10/2013 | 10 | 25 | 40.0 | 1G, 0A |
| Daniel Briere | PHI | 1/29/2013 | 10 | 27 | 37.0 | 0G, 0A |
| Zach Parise | MIN | 2/7/2013 | 8 | 23 | 34.8 | 0G, 0A |
| Jarome Iginla | CGY | 2/20/2013 | 9 | 27 | 33.3 | 0G, 1A |
| Jeff Skinner | CAR | 3/21/2013 | 6 | 18 | 33.3 | 1G, 0A |
| Rick Nash | NYR | 4/27/2013 | 7 | 21 | 33.3 | 2G, 0A |
| Defense | ||||||
| Player | Team | Date | Sh | Team Sh | %TSh | Stat Line |
| Erik Karlsson | OTT | 2/12/2013 | 9 | 31 | 29.0 | 1G, 0A |
| Brenden Dillon | DAL | 3/16/2013 | 5 | 19 | 26.3 | 0G, 0A |
| Keith Yandle | PHX | 2/16/2013 | 9 | 35 | 25.7 | 0G, 3A |
| Zach Bogosian | WPG | 3/30/2013 | 9 | 35 | 25.7 | 0G, 0A |
| Dustin Byfuglien | WPG | 3/8/2013 | 7 | 28 | 25.0 | 1G, 0A |
| Dustin Byfuglien | WPG | 3/21/2013 | 5 | 20 | 25.0 | 0G, 0A |
Not a lot of surprising names on that forwards list, but maybe an eyebrow-raiser on defense. Perhaps it’s hard not to miss the comparison of the numbers of those defensemen to those in the 1987-88 list; perhaps, then, these next two charts aren’t too surprising, either.
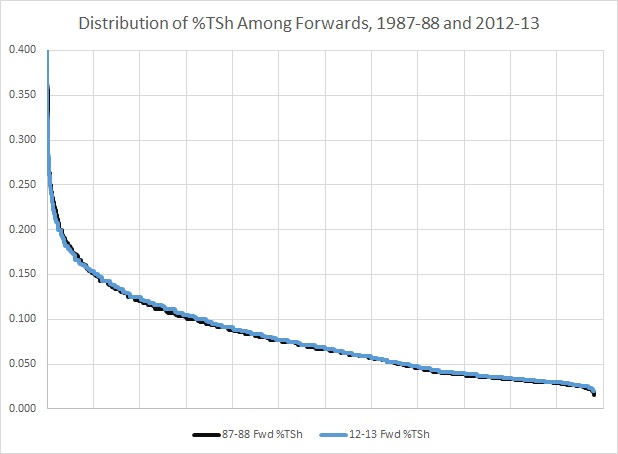
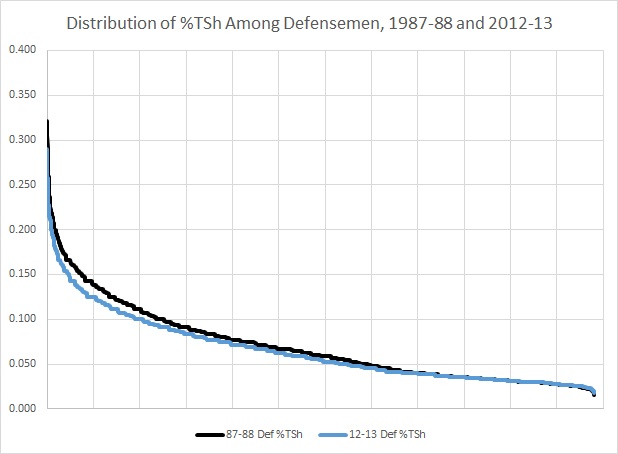
First of all, it’s remarkable how close those forward distributions are. They are about as identical as two sets of 25K+ performances can get. The second graph is just as remarkable, as it suggests to us that there were more higher %TSh performances among defenders in the 1987-88 season. If we break down the %TSh into consecutive buckets of 5% attempted shots, it’s just as clear:
| Bucket | 87-88 D | 12-13 D |
| 0.000 | 0.313 | 0.322 |
| 0.016-0.050 | 0.296 | 0.317 |
| 0.051-0.100 | 0.251 | 0.253 |
| 0.101-0.150 | 0.097 | 0.083 |
| 0.151-0.200 | 0.033 | 0.021 |
| 0.201-0.250 | 0.007 | 0.004 |
| 0.251-0.300 | 0.002 | 0.000 |
| 0.301-0.350 | 0.000 | 0.000 |
| 0.351+ | 0.000 | 0.000 |
There were simply more defensemen shooting higher percentages of their team’s shots. In other words, you can’t look at the decrease in offense as a function of more defenseman involvement in offense; in fact, this might be an indicator of defensemen deciding to not jump into the rush, a sort of anti-Bobby Orr trend. So maybe, rather than Dustin Byfuglien or Jack Johnson being “riverboat gamblers,” they are 1980s defensemen who’ve become unstuck in time.
It’s important to add, however, that this doesn’t register in any change of defensemen’s percentage of shots taken in-total. Forwards are still taken about the same percentage of overall shots, and among forwards the distribution remains nearly identical. This suggests that forward usage (4 lines, with top 6 getting primary minutes and the 3rd having a checking role) has remained the same. It also suggests that teams are using roughly the same “systems” with regards to their defensemen, thought its possible that there has been more reliance on 3rd pairing powerplay specialists, or some other diffusion of those shots.
Whatever the case, any systems argument, or any discussion of the evolution of the game, has to tackle these fundamental truths: that the game has a form and a process, that players have long developed best practices* for this form, and despite any lip service to “better systems” the numbers suggest similar results. With this information, it becomes very apparent that low scoring is not going to go away by tweaking the size of leg pads. And a kernel within this is probably where “shot quality” surrenders to the immutable fact that all teams want scoring chances, and want to prevent scoring chances; the best teams accomplish both, and no team purposely takes shots without trying to score.
*Probably the most recent, “new” best practice is trying to carry the puck into the zone, a holdover from Soviet-era hockey; Eric Tulsky at Outnumbered has covered this extensively. In that piece, Tulsky speculates that maybe, indeed, the Kings have a unique system that’s generating shots.

One thought on “NHL Systems, NHL History, and Forward vs. Defense Shooting”