If you ever work for a hockey team as an analyst, you could be facing two very recurrent questions from the coaching staff. The first one is very practical: How can analytics help us work better and faster? The second one is: What is the real contribution of each player? Meaning beyond the usual on-ice “possession” stats like Corsi or Expected Goals and individual production metrics such as shots taken, scoring chances, expected goals created, zone exits, entries, or even high-danger passes (passes that end or go through the slot). But those events were not yet statistically linked to each other. Finding a way to provide answers to both questions was my goal for the last few months, and the solution was: I needed to split the game in “Sequences”.
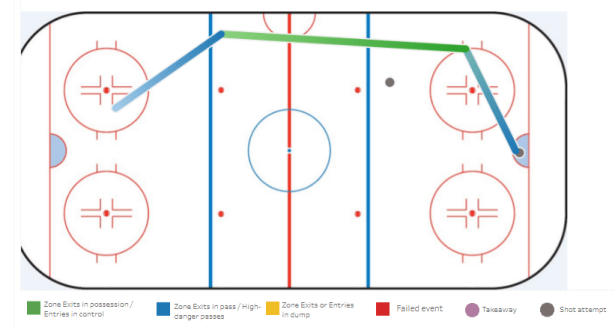
Video coaches often break down game tape to highlight certain plays, such as a rush-based attack or a zone exit under pressure. I wanted to do the same and divide a game in as many parts as necessary, or “Sequences”. Roughly, every time the puck changes possession between teams, a new Sequence” begins. That’s about 250 Sequences per game.
Looking at this from the point of view of the team that owns the puck, offensive Sequences extend from the moment a team gets control of the puck and starts moving forward, to the moment she loses it for good, and it must include a shot attempt in the process to have a positive value. How does this work? Let’s say a player gets the puck back in your defensive zone, you try a zone exit but fail. Sequence starts over, there can only be one exit recorded in the Sequence. So he tries another zone exit and succeed, gets into the offensive zone, the team records a couple of shot attempts, loses the puck and if the other teams gets enough control of it to try a zone exit, it means the end of the Sequence.
How does this help? Well, the basic principle is to see the total value of a Sequence. We’re use Expected Goals as our measure of “value”. To do that, we add the Expected Goals of the shot attempts in the Sequence. For example, a Sequence with two shot attempts:
- A high danger shot: 0.23 Expected Goals
- A shot from the blue line: 0.01 Expected Goals
- Total Sequence value: 0.23 + 0.01 = 0.24 Expected Goals
Continue reading →

