Increasingly in the NHL, the Best Defense is a Good Offense

Photo by Lisa Gansky, via Wikimedia Commons; altered by author

Photo by Lisa Gansky, via Wikimedia Commons; altered by author

While preparing statistics for a few upcoming posts on on-ice contributions, I decided to do a quick study on the share of on-ice shot attempts taken by defensemen versus forwards. The metric I’m using, which is a spin-off of an old one whose name doesn’t quite capture it right, is what I’m calling on-ice shooting proportion, or OSP. The results were quite interesting, and I decided that I should test the data a little further and see what we could find.

Continue reading

The NHL Systems Argument: Comparing Bruce Boudreau, Alain Vigneault, & Lindy Ruff

Bruce-Alain Ruff. Looks like the ghost of Gene Hackman. You're welcome for the nightmares.  Composite of images by

“Bruce-Alain Ruff. Looks like the ghost of Gene Hackman. You’re welcome for the nightmares.” Composite of images by “DSCF1837” (Vigneault), Michael Miller (Boudreau), and Arnold C. (Ruff), via Wikimedia Commons*

Systems are without question the most elusive, yet most important, part of our understanding of hockey and the application of analytics. What works and what doesn’t? To what degree can a coach or team apply a strategy?

This led me to think about where we might most convincingly see evidence of a system at work. In the past, we here at HG have had a lot of skepticism about a number of elements of a “system.” For example, Garik’s pieces on competition-matching lines (here and here) and the use of the “defensive shell” to protect a lead, neither of which presented themselves as particularly effective ways of looking at or implementing systems. I have shown in the past that attempts to use extreme deployment in terms of zone starts doesn’t move the needle beyond a 60-40 range of possession, the range of shooting shares for forwards and defensemen haven’t seemed to change much over the last 20-25 years, and a plotting of even-strength shots-for with top and bottom possession teams do not suggest a major difference in shot location.

So where to go from there? Eventually, I decided that we need to get to an extreme enough situation, with robust enough data, where a team might have the best opportunity to dictate a system — in other words, we need to look at the powerplay. The most ideal opportunity for comparison, given the workable data for me, comes from the coaching careers since 2008-09 of Bruce Boudreau, Lindy Ruff, and Alain Vigneault. They all provide at least a couple of seasons with different teams, in addition to a robust set of coaching data from 2008 to the present. Let’s see what we can see…

Continue reading

Friday Quick Graphs: Total Player Charts, Revived

Bringing back an older concept…a few years ago, I was spurred by Tom Awad’s “Good Player” series to put together these radar charts of player ice-time. I’d always felt, for fantasy hockey purposes, it is important to know the boxcars (goals, assists, points) come from the ice-time as much as anything, and so the initial creation of what I called “Total Player Charts,” or TPCs, was to portray precisely that. It ended up that they gave intriguing portrayals of players that we felt had strong seasons. See Jamie Benn’s above; an Art Ross Trophy, sure, and much of it came from near the top share of playing time at evens and on the powerplay, league-wide. You can also get a sense of just how valuable a defenseman like T.J. Brodie is:

Continue reading

Who are NHL Coaches Playing More with the (Big) Lead?

Photo by Michael Miller, via Wikimedia Commons

Johan Larsson’s TOI% jumps 8.5% when the Sabres are leading by 2 or more goals (which is never). Photo by Michael Miller, via Wikimedia Commons

Right out the gates, I knew two things: 1) I wanted to take TOI% data from close scores and subtract it from TOI% data from 2+ goal leads, and 2) that it would automatically tell us that perceived poorer players are given more playing time with the lead. Why? Because they tend to play less when the score is close, which increases the likelihood that a differential with 2+ goal time on-ice will show they get to play more with a big lead. That said, I wanted to run a quick study to see just how much of a difference that time swing could be, and which players come out of the woodwork on either end.

But first, I want to whittle away the small sample players, and to do that I’m going to run a quick test to see at what # of games played this TOI 2+ minus TOI Close differential (let’s call it “TOI Lead Diff”) stabilizes.

Continue reading

Friday Quick Graph: Player Career Charting by Percentage of Team Shots, 1967-68 to 2012-13

Embedding interactive graphs into blog posts, especially blogs with a narrow runner like ours, is frequently an awkward process. Just about the time things look good, you tinker with it and it looks bad. Nevertheless, I had a bunch of old data I put together, once upon a time, and I wanted to get it out there in a form that you could tinker with. Basically, in the past I have used the percentage of team shots in the games a player participated (%TSh; explanation here) as a way to capture a player’s contribution to the shot load; I also think it strongly implies a player’s involvement and contribution to team offense overall.

In the case of today’s graph, I took %TSh and looked at aging curves with a multitude of players from 1967-68 through 2012-13 (like I said, the data is a little old). I prepared this with a selected group of players available for the filter, the majority of whom are stronger, more familiar players of the years covered. I also included some players that struggled by the metric, for the sake of comparison. To filter, click on the “Name” bar, click on “Filter,” and let your imaginations run wild. Feel free to download if you wish.

Note: I believe I set the cut-off at 20 GP before I would record the point of data. It’s old. I’m old. We’re all getting older.

NHL Forwards vs. Defensemen Height & Weight, 1917-18 to 2014-15

Photo by Eric Kilby, via Wikimedia Commons

Photo by Eric Kilby, via Wikimedia Commons

Building on my post from last week on overall skater height going back to 1917-18, I wanted to dig a little further into the the complexity of the data to see if there were any interesting takeaways. This included breaking the data into forward and defense data, to see if there was every any substantial increase in defenseman size or any other allusions to an attitude change in terms of size trends and preferences. While there are some slight differences, most interesting to me was, for as many changes as the NHL has undergone, there seems to be a uniform attitude about size when looking at forwards and defensemen.
Continue reading

Friday Quick Graph: NHL 5v5 TOI Peak at 24, 25 Years Old

This is the distribution of the skater performances w/200+ 5v5 TOI from the seasons 2007-08 through 2011-12 (n = 3,334). Use as reference for the below two charts. Notice that our line gets a little wacky as our n drops near the tails.

Some of you already know this, but I enjoy distributions, and I think they get sorely under-used in analysis (although, in the end, they are the basis of predictive work). This piece is a bit old (the data is across all skaters, 2007-08 through 2011-12, n = 3,334), but it shows the number of skaters with 200+ minutes of 5v5 time at each age grouping. The peak is clearly at 24 or 25 among this group, but we should be clear with what “peak” means. Although even-strength time can be a pretty good indicator of overall player talent, it’s still a shaky signal (c’mon, we know not all coaches put the “right” guys out there sometimes). Further, powerplay time can sometimes be a drag on better players’ energy for even-strength time, which can also compromise this signal. Nevertheless, if you were to sort all players into even-strength time groupings (say, forwards in 4 groups by ESTOI, and defensemen in 3 groups by ESTOI) you’d see that the top would generally perform better possession and offense-wise than the second, and so on down.

With that in mind, “peak” is also about health. Though we’ve not had much research into it (hint, hint), we have reason to suspect that injuries might drag on possession measures a bit. That said, 24-25 can also be a performance peak for the reason that players are less likely to have major injuries until that age or later.

I plan on digging into this data again (now that I have my ES data back to 1997-98) and splitting into forward and defense groups, but this is a good start.

On Guys Who Score But Don’t Drive Possession

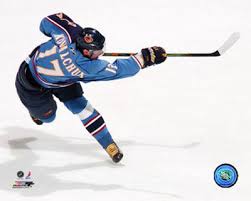
This dude didn’t drive possession much, but MAN what a shot.

Consider four types of forwards:

1.  Forwards who don’t drive possession and don’t score points
2.  Forwards who drive possession forward and score points effectively
3.  Forwards who drive possession forward but don’t score points
4.  Forwards who don’t drive possession but score points.

The first two types of forwards are easy to think about: Type 1 forwards are bad players, not really giving value through their play and Type 2 forwards are the best type of players, those who provide value in both offense and defense and aren’t a liability if they ever go on a cold streak.

Type 3 forwards are a little trickier, but really aren’t that hard to think about – they’re your ideal 4th and maybe 3rd liner, the guy who might not score but keeps your team in the game while your better guys rest.

Then you have your type 4 forwards – the dudes who can score a bunch of points but really don’t keep the puck out of your own zone and in the opponent’s zone.  Perhaps these guys are really bad defensively, perhaps they’re completely inept in the neutral zone, or perhaps they’re guys who score mainly by being in front of the net at the right time, and thus aren’t really being helpful when the puck doesn’t come to them.

How do we value these guys?  Depending upon the point totals these guys can put up, we can value them pretty high actually.  Ilya Kovalchuk was a pretty damn good player who didn’t drive possession much, but his scoring almost certainly made up for what he cost the team otherwise.  Matt Moulson’s hands allowed John Tavares to rack up assists due to his amazing ability to be in the right position to put in goals.  Thomas Vanek likewise.

In a sense, these guys are basically role players.  Of course, that role isn’t being a grinder or a checker or some other name for defensive forward, it’s to be an offensive specialist, paying little attention to anything else.  You’d like to play these guys in positions that maximize that ability like any other role player – so high ozone starts, alongside guys who might complement those skills (playing them alongside guys who don’t have these weaknesses, and thus can make their line a plus possession line, is another typical way to handle these guys).  And scoring lots of points is a pretty important type of role for a player to have.

Most of the time, the best scorers don’t fall into this category – the skills involved with being a plus possession player are the same ones that lead to scoring goals – getting the puck into the zone by carry-in, spending more time in the O Zone, etc.  But a few guys will – think Ilya Kovalchuk or perhaps even the more recent version of Alex Ovechkin (though he used to be a clear driver of play).  These are guys you play as much as possible despite the possession problems simply because well – scoring is what wins games in the NHL.  These guys aren’t that common, so you’ll never see a low possession team dominate for multiple seasons like you did in the 80s (when three teams did accumulate such players).  But you play them anyhow and you try and surround them with a lot of plus possession talent to make up for their shortcomings.

Again, these players aren’t bad by any means – they can even be elite!  Of course, lacking possession driving skills means slumps by these guys will kill you, but for your Kovalchuk’s and Ovechkins, you’ll live with that.