In this week’s episode, Rhys and Garret break down the Western Conference playoff race and take a look at some recent mock drafts. Click past the jump to listen!

In this week’s episode, Rhys and Garret break down the Western Conference playoff race and take a look at some recent mock drafts. Click past the jump to listen!
This is part-opportunity to finally explore this question, and part-opportunity to tout some existing and upcoming data visualizations for HG. Travis Yost has been following the absolutely terrible Sabres season all year, and has raised some questions about whether it’s an all-time worst team. He’s only been able to reach back to the admittedly bad early 2000s Atlanta Thrashers, but the historically bad team by which all others need to be measured is the 1974-75 Washington Capitals squad. Using an historical metric like 2pS%, or a team’s share of all on-ice shots-for in the first 2 periods (expressed as a percentage), we can bring the 2014-15 Sabres together with the 74-75 Caps to see where both teams stand. Note: I used the cumulative version of the measure below, and added lines for one standard deviation below league-average in both seasons.
For as bad as Buffalo has been, they haven’t quite matched the futility of the 74-75 Capitals…nor should they. The Capitals were an expansion team that year, and unlike in other years the NHL did not really reach out to ensure the expansion teams in 1974-75 were given a good base to build from. These were also the peak years of the World Hockey Association, which made professional level talent even more diffuse than normal. The other expansion team in 74-75, the Kansas City Scouts, lasted two years before moving to Colorado to become the Rockies (the team subsequently moved to New Jersey in 1982-83 and changed their name to the Devils).
I included the standard deviations for the leagues in 1974-75 and 2013-14 (I haven’t compiled the data for 2014-15 yet, but this should be close enough), and even by those markers the Capitals compared markedly worse to their league than did the Sabres. But once again, the Capitals had a reasonable excuse, while the Sabres have walked into this situation with eyes wide open.
For those interested, I also put together 2-period shots-for and shot-against rates (and stretched them out to per 60 minutes) to get a rough sense of offense-versus-defense for both teams.
I added a couple extra filters to the charts, league-averages and standard deviations as well as 20-game moving averages in all the measures I used, which you can select by clicking on the grey “Team” bars and clicking on “Filter.”

Sort of a mid-week quick graph…I’ve been compiling data for a different project and curiosity got the best of me to see what the spread in team shooting percentages was in NHL history. We all know that shooting percentage in the NHL went up substantially during the 1980s, but what you’re seeing above is one of the reasons why we theorize that shot quality and team shooting talent might have figured more greatly in outcomes in the 1980s than it does today. With some exceptions, the standard deviation seems to have settled from about 1996-97 to the present at just under 1%, which suggests our expectations from one year to the next should only allow a team that much of a bump above or below league-average. It’s worth noting that sample will affect this measure, hence why our line is so spiky during the Original Six era, and why 1994-95 and 2012-13 might have not been as characteristic of a trend. Incidentally, this is shooting percentage for all situations.
Note: As mentioned by a reader, increased scoring is going to work together with this standard deviation to accentuate the differences between teams. League-wide, the shooting percentage and standard deviation move well enough together to cause this effect, usually portrayed by coefficient of variance, to regress heavily from 1965 to the present. The exceptions, though muted, would be the early 1980s and the more recent years of Dead Puck, so the standard deviation fairly accurately represents our variance above. CoV data:
Continue reading
On this week’s episode, Rhys and Garret talk about Michael Hutchinson’s recent struggles, Jacob Markstrom’s inability to make the NHL transition, the Canucks signing of prospect Ben Hutton, Corey Pronman’s trolling of Rhys, and some Alberta Major Bantam talk to top it all off. Join us on the other side of the break to listen!

(Image courtesy of Wikimedia)
Welcome to a brand-new, semi-regular segment where I -Garret Hohl- will touch on a few trending topics in hockey statistics in a less mathematical and more discussion format.
This week we will explore the debate on shot quality impacts on save percentage.
So let’s begin.
Back on the usual Monday/Tuesday schedule, Garret and Rhys try to talk about how injuries have affected the Canucks and Jets and their upcoming schedules and playoff chances, but get sidetracked and discuss why plus/minus is terrible instead, among other fun things.
There’s also some good old prospectin’ too, so join us on the other side of the jump!
Between their usual ramblings, Garret and Rhys somehow find time to discuss Monday’s NHL trade deadline.
Join us after the jump to listen!
Continue reading
Embedding interactive graphs into blog posts, especially blogs with a narrow runner like ours, is frequently an awkward process. Just about the time things look good, you tinker with it and it looks bad. Nevertheless, I had a bunch of old data I put together, once upon a time, and I wanted to get it out there in a form that you could tinker with. Basically, in the past I have used the percentage of team shots in the games a player participated (%TSh; explanation here) as a way to capture a player’s contribution to the shot load; I also think it strongly implies a player’s involvement and contribution to team offense overall.
In the case of today’s graph, I took %TSh and looked at aging curves with a multitude of players from 1967-68 through 2012-13 (like I said, the data is a little old). I prepared this with a selected group of players available for the filter, the majority of whom are stronger, more familiar players of the years covered. I also included some players that struggled by the metric, for the sake of comparison. To filter, click on the “Name” bar, click on “Filter,” and let your imaginations run wild. Feel free to download if you wish.
Note: I believe I set the cut-off at 20 GP before I would record the point of data. It’s old. I’m old. We’re all getting older.
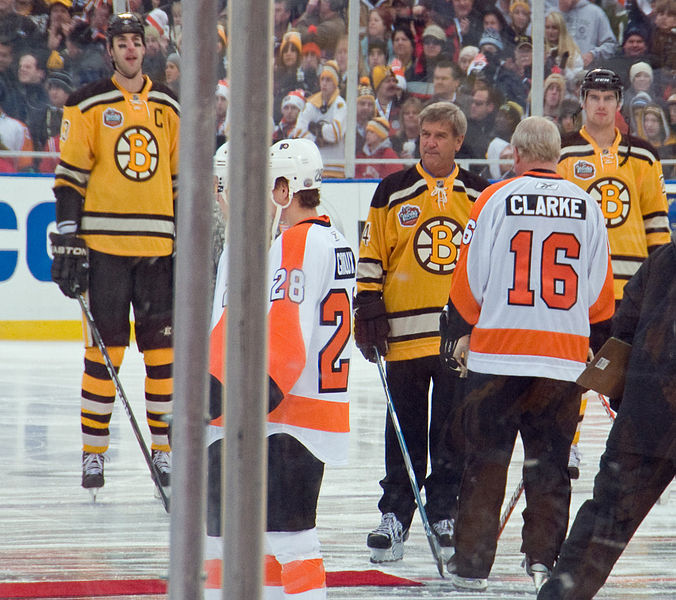
Photo by Eric Kilby, via Wikimedia Commons
Building on my post from last week on overall skater height going back to 1917-18, I wanted to dig a little further into the the complexity of the data to see if there were any interesting takeaways. This included breaking the data into forward and defense data, to see if there was every any substantial increase in defenseman size or any other allusions to an attitude change in terms of size trends and preferences. While there are some slight differences, most interesting to me was, for as many changes as the NHL has undergone, there seems to be a uniform attitude about size when looking at forwards and defensemen.
Continue reading

“Jackets-Canucks Face-off” by Leech44 – Own work. Licensed under CC BY-SA 3.0 via Wikimedia Commons.
A debate was ongoing on twitter over faceoffs and their value. The debate lead to most of this data being scraped anyways, so I thought I would display everything for your viewing pleasure.
The truth is, faceoffs tend to be highly overrated. They matter, but they do not matter on average much more than any other of the many puck battles that occur throughout the game. When you really break it down, faceoffs are really just a set play puck battle after all. However, some have more values than others.
Let’s take a look.
