

Image courtesy of WikiMedia
Not long ago, we researched hit and face off differentials and their relationship with playoff performance, in both the same statistic and in goal performance.
As a fan of the Winnipeg Jets, who lead the league for worst penalty differential for much of the season, I find it a very interesting topic to research. More power plays and less penalty kills means a better team goal differential over the course of a season, by a significant amount.
Let’s take a look after the jump.
ABSTRACT
The playoffs are often considered unique from regular season. The stakes are higher and pressure impacts individuals differently. The level of competition rises with the lower teams not making the cut. The calls are “looser” and allow for more physicality (more on this later).
The sample sizes are also extremely smaller and a four game cold streak can send even the best team in the league home.
We looked at multiple regular season penalty differentials in how closely they relate to themselves in the post-season and also playoff goal differentials. We then also compared these results to our previous.
Overall, we found that out-performing the opposition in drawing penalties in the regular season had a weakly positive relationship with out-scoring the opposition in the post-season.
METHOD
Data on each team’s individual post-season results was pulled for every full 82-game regular season since 2007. The regular season data for those same teams was pulled as well.
The statistics that were selected to be compared: Penalties, Hits, Face Offs, Corsi, Fenwick, Shots, and Goals. All data was for 5v5 only, and not restricted for close or score-adjusted situations. All statistics were compared in three different forms: differential, differential per minute, and percentage.
The Pearson’s correlation coefficient was then measured for each statistic twice:
1) Regular season values to post-season values of the same statistic
2) Regular season values to post-season 5v5 Goals
3) Regular season values to post-season All-minutes Goals
RESULTS AND COMMENTS
Figure 1: Regular Season to Post-Season Self Correlation
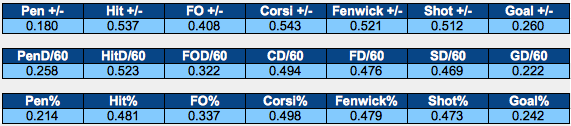
In all three forms, a team’s hits, Corsi, Fenwick, and shots statistics in the regular season have a fairly strong relationship with the same measure in the post season. All of these carry an r-value of about 0.4-0.5.
Goals and penalty differentials however do not have quite as strong as a relationship, relatively speaking, with an r-value around 0.2-0.3.
Faceoffs sit in the middle with an r-value around 0.3-0.4.
Figure 2: Regular Season to Post-Season 5v5 Goal Correlation of Same Type
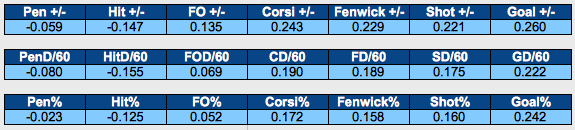
Note: penalty differentials were accidentally placed backwards with being Penalty Served – Penalty Drawn, so the above r would switch signs if looking at a team’s true penalty differential with being Penalty Drawn – Penalty Served.
The above is the r-value of each statistic in the regular season to the post season goal statistic on the far right of the same row.
Corsi outperforms shots in all three cases, although the difference is quite small. Face offs and penalty differentials have weak relationships with goal differentials, while regular season hit statistics actually have a weak negative relationship with post-season goal differentials.
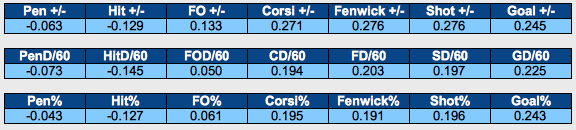
Figure 3: Regular Season to Post-Season All-Situations Goal Correlation of Same Type
There is an issue with the correlations above. Figure 2 is not very meaningful for penalty differentials. The reason why a team hopes to draw more penalties than they get called on is because a power play severely increases the probability they will score next, due to the power play. Comparing penalty drawing to 5v5 out-scoring is pointless.
Still, when changing the out of sample correlation from 5v5 out-scoring to all-minutes, the strength in relationship improves but not by much.
DISCUSSION
How well a team outhits, out wins face offs, and out draws penalties in the regular season does not seem to have an overly strong relationship with how well a team out scores in the post season.
The shot metrics Corsi, Fenwick, Shots, and Goals fell similar to what we already have seen with predicting future regular season success, given the sample size, and other actors.
Now there are a few side-topics from this study I would like to discuss.
Less Penalties Called in Post-Season
While the Jets were struggling to win games and the primary source seemed to come from their penalty differential, many discussed how this should work to the Jets favour if they make it into the playoffs.
The proclamation was usually supported with saying that in the playoffs there are less calls and power plays.
From this study, I did not find that to be true.
In the regular season (for 5v5), these teams were called for 3.16 penalties per game and 4.09 penalties per sixty minutes. In the playoffs, the teams were called for 3.31 penalties per game and 4.16 penalties per sixty minutes (again, all for 5v5).
I do believe that referees let more go in the playoffs. However, my guess would be that this fact causes teams to try and get away with more. The two opposite impacts then counter each other, and create a similar number of infractions
Goals Out-Performing Shot-Metrics
Now I’m sure some of you reading this are wondering why we are seeing shot-metrics perform inferior to goal differentials. One has to remember the famous saying that correlation does not equate to causation.
There are a few important factors not being accounted for here. Shot-metrics predictiveness increases when adjusting for things like arena bias and score-effects. They also improve if you look at the most recent 25 games due to flowing dynamic of a team’s roster.
Another thing is the playoffs is not the same as the regular season. No, I’m not talking about stylistically, or about the pressure, or about the “looser calls”. In the regular season every team faces fairly similar quality of competition and also has an equal number of home-to-road games.
This is not true with the playoffs. Teams that rank higher in the standings on average get more favourable match-ups than not, while also receiving home advantage more often.
We care about factors like Corsi and Fenwick due to their ability to predict future wins. Shot metrics relate closer to future out-scoring, while past goal metrics IS past out-scoring.
My hypothesis would be that if one were to repeat this study with adjusting for home-ice advantage, score-effects, and opposition, then shot-metrics would out-perform goal differentials.
My guess is the playoff berth advantage is in part why some like Travis Yost found last-25-games, score-adjusted Fenwick out perform score-adjusted Corsi in predicting who wins a playoff series. While Corsi tends to out-perform Fenwick in correlating to future goal differentials, Fenwick correlates closer to goal differentials in the same sample.
Of course, there is the possibility that 82 games is sufficient enough sample for goal-metrics to surpass shot-metrics. It is really hard to know definitively without accounting for the above situations.
CONCLUSION
How often a team out performs their opponent in hit, face off wins, and penalty differentials does not seem to predict future success, even in the playoffs. These may be for different reasons.
For hits, the effect seems to come from the fact that teams who out-hit tend to be out-possessed and out-shot. It’s hard to hit your opponent when you always have the puck. Kent Wilson once had a good analogy on this effect with blocked shots. Killing a pest like a rat in your place is often a necessary and preferred outcome to not killing it; however, it is a bad sign if you are needing to do it all the time.
For penalties and face offs it is likely due to the tight distributions in performance. Penalties are not that common, so out drawing an opponent in a 4-7 game series likely only gives a team a few extra power play opportunities. Over the course of a season it can have a large impact (see Calgary Flames), but not so for 4-7 games.
For face offs, most teams and players sit very close to 50%, with a few exceptions. In addition, face off differentials ignore that neutral zone face offs have almost no impact on goals.
Hitting your opponent, winning a face off, and drawing a penalty are good things. There are bonafide reasons why coaches should care about these factors. This doesn’t mean they are as important analytically speaking.
One must always remember that the results we see are shaped by the environment. All teams want to hit their opponent, win a face off, and draw penalties. If many teams stopped, we’d likely see the results change.
Aside: Whenever trying to predict post-season, keep in mind that you are predicting something that is highly luck (read: variance and outlier) influenced. The median post-season team plays eight games in the playoffs (duh), while the mean and standard deviation are eleven and six. With samples as small as this, you must remember that you are trying to predict success generated by both talent and luck.
