

There has been a few tries in trying to find what drives special team success on the penalty kill and the power play. One thing though that hasn’t been talked about enough is the time factor and how it can impact a team.
Think about what we already know of defensemen. We already know that defensemen who are not adept at protecting in the defensive zone may more-than make up for this by pushing the play forward and never being in the defensive zone.
For special teams it can be similar. Having a terrible penalty kill two times worse than average isn’t as dangerous if you see three times less penalties.
I recently broke down on Jets Nation how the Winnipeg Jets abnormally large penalty minutes have been killing them. I held their goal rates constant for each team and simply looked at how much changing their time on ice affected total goals.
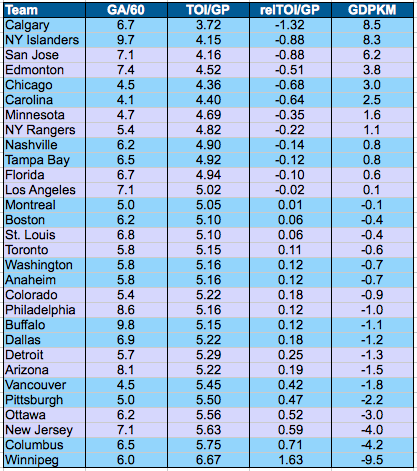
Here are the numbers on the penalty kill for all teams in the NHL this 2014-15 season:
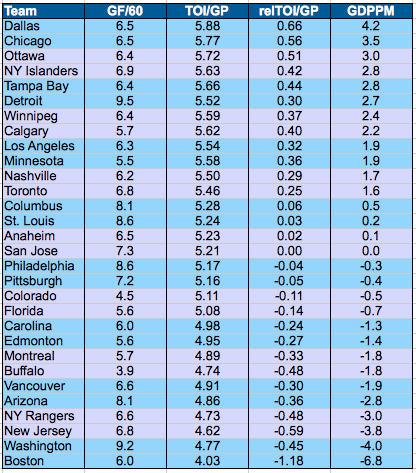
Here are the same numbers for power play situations for all teams in the NHL this 2014-15 season:
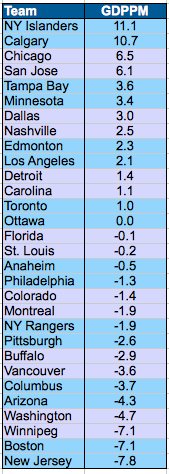
Combining the impact on both situations gives the following goal differentials:
Many have been wondering how the Calgary Flames have been out performing their 5v5 shot metrics. This could be one reason why. I haven’t looked at any sustainability levels of these measures, so this is descriptive not predictive. However, I would not be surprised to see teams tending to be pretty consistent in their discipline levels, even if teams tend to be pretty inconsistent in their effectiveness in special teams.
One area that this quick study could probably be improved upon is looking at whether using a team’s goal rates or league average rates better predicts future goal differentials deriving from special teams’ play. How much future success is driven by discipline and how much by strong effectiveness on special teams?
Another factor to note is I ignored goals for on the penalty kill and goals against on the power play. My reasoning is that the small 1-10 goals is likely variance driven for the most part; however, I do not actually know if that is true. Some success may be driven by differences in strategy: does a team dump the puck or create their own offensive zone pressure.
A final issue is that I’m using TOI, which is also impacted by how strong or poorly a team performs. A team with a weak PK will see their TOI lower than than their number of penalties created relative to average.
