

Photo by Bobby Schultz, via Wikimedia Commons
Though it was completely tangential to @SteveBurtch’s line of thinking, his brief comments pondering the competitiveness between the middle of NHL lineups yesterday (which I can’t locate now, natch) got me thinking about whether the NHL and team management has gotten any more efficient or competitive overall the last decade. With 10 years in the books for complex Corsi data, and hockey’s seeming “Moneyball moment” fully here regardless of the quibbling on social and mainstream media, is the league getting any tighter?
At least initially, when I looked at the data it seemed like the answer is mostly yes. Take our standard deviations among some of the major “team talent” and “team performance” 5v5 metrics over the last decade:
| Season | CorsiFor% | CorsiFor/60 | CAgainst/60 | Sh% | Sv% |
| 2007-08 | 3.1% | 3.62 | 4.95 | 0.93 | 0.81 |
| 2008-09 | 3.2% | 3.93 | 4.70 | 0.82 | 0.80 |
| 2009-10 | 2.9% | 3.83 | 4.07 | 0.73 | 0.83 |
| 2011-12 | 2.7% | 3.92 | 3.49 | 0.86 | 0.79 |
| 2010-11 | 2.5% | 3.64 | 3.74 | 0.58 | 0.82 |
| 2012-13 | 3.2% | 4.18 | 5.05 | 1.10 | 1.05 |
| 2013-14 | 3.4% | 4.19 | 5.02 | 0.77 | 0.81 |
| 2014-15 | 3.6% | 4.60 | 4.51 | 0.79 | 0.81 |
| 2015-16 | 2.6% | 4.03 | 3.23 | 0.65 | 0.62 |
| 2016-17 | 2.1% | 3.06 | 2.91 | 0.87 | 0.68 |
| 2017-18 | 2.2% | 3.33 | 2.67 | 0.75 | 0.68 |
It certainly does seem that there is some tightening on the surface, especially over the last few years. Out of curiosity, though, I was also interested to see if the reputed “tanking” and relaxed-playoff-bound teams were having any influence over our measures. Chipping away to the middle 2/3 of the NHL teams, their standard deviation trends (again at 5v5) looked a bit different:
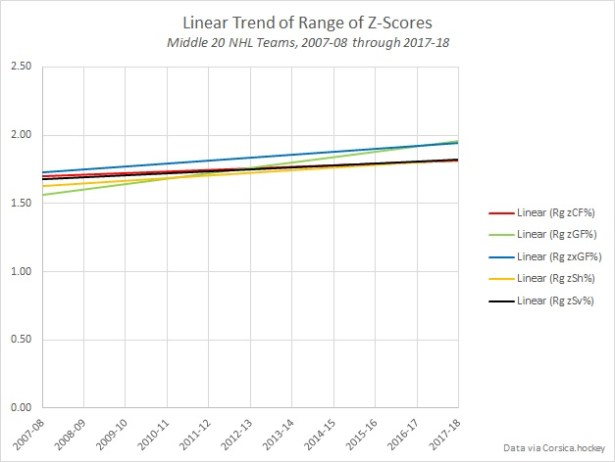
Albeit somewhat bouncy (hence the linear smoothing), all these metrics among the middle teams have a slight upward trend (0.25 in z-score is not really “slight”, but I’m allowing for the variance). So it does seem that, while the overall league is getting more competitive from the tails, the heart of the league is still seeing sizable – and potentially growing – distance between its firm playoff-bound teams at the top-middle and the struggling teams at its bottom-middle. It’s even the case in those more-stubborn, randomness-influenced metrics like shooting and save percentage.
One last thing: if we’re even considering whether the league is getting more competitive, and I’m saying there’s some yes and some no, then what about the increased scoring, bud? We do know things spiked a bit this year, and shouldn’t it be that a more competitive NHL would stifle scoring? Well, it’s likely coming from a pleasant source among our 5v5 measures:
| Season | Corsi/60 | Sh% | Sv% |
| 2007-08 | 50.94 | 8.01 | 91.98 |
| 2008-09 | 53.27 | 7.93 | 92.06 |
| 2009-10 | 54.00 | 7.97 | 92.00 |
| 2011-12 | 54.07 | 7.83 | 92.17 |
| 2010-11 | 54.98 | 7.84 | 92.19 |
| 2012-13 | 53.86 | 7.95 | 92.08 |
| 2013-14 | 54.42 | 7.73 | 92.26 |
| 2014-15 | 54.39 | 7.73 | 92.27 |
| 2015-16 | 54.10 | 7.51 | 92.50 |
| 2016-17 | 54.98 | 7.67 | 92.32 |
| 2017-18 | 57.44 | 7.75 | 92.26 |
A nice little uptick in Corsi there! While holding out the possibility we’re within random variance, or at the very least variance resultant from the upset that usually comes to the league with expansion, increasing chance creation seems to have jostled an NHL that is getting better at stopping shots (keep in mind the tightening save percentage standard deviations above).
Realizing it’s bad form to not answer my initial question…the league is getting more competitive from the top and bottom generally, but the middle teams still appear to have some distance between them. Excitingly for hockey fans, though, the variance among the middle teams seems to be coming from a league that is generating more scoring chances. While I’d like to be optimistic that the “Moneyball moment” made the difference – like it has in reducing all-fight-no-play 4th liners and increasing the number of smaller, playmaking forwards – the change should be gradual, not spiking, and I think we have to allow there was some expansion shakeup during the 2017-18 season.
