Behind the Numbers: Where analytics and scouts get the draft wrong

Every once-in-a-while I will rant on the concepts and ideas behind what numbers suggest in a series called Behind the Numbers, as a tip of the hat to the website that brought me into hockey analytics: Behind the Net. My ramblings will look at the theory and philosophy behind analytics and their applications given what is already publicly known.

Hello everyone; I am back! I was in the process of writing an article on NHL prospect development for after the draft (teaser!) when a Twitter thread sparked my interest and made me want to do a bit of a ranty, very pseudo-Editorial or Literature Review on analytics and the draft while combing over that thread.

Continue reading

Behind the Numbers: Pareto’s Principle, Power Law Distribution, and when tracking data does not matter

Every once-in-a-while I will rant on the concepts and ideas behind what numbers suggest in a series called Behind the Numbers, as a tip of the hat to the website that brought me into hockey analytics: Behind the Net. My ramblings will look at the theory and philosophy behind analytics and their applications given what is already publicly known, keeping my job safe while still getting to interact with the public hockey-sphere.

Hello. Hope everyone is enjoying my return after a long hiatus. I am back from my busy schedule of helping run a tracking company that sells private tracking data to argue here against overvaluing private tracking data (and in addition black-box models)… or really I’m suggesting to not underrate what’s in the public.

You heard that right. The guy that has vested interests in demonizing public models and data is going to defend public models and data!

Continue reading

Behind the Numbers: Theory on Environmental Impacts and Chemistry

We’re bringing it back! Every once in a while I will rant on the concepts and ideas behind what numbers suggest in a series called Behind the Numbers, as a tip of the hat to the website that brought me into hockey analytics: Behind the Net. My ramblings will look at the theory and philosophy behind analytics and their applications given what is already publicly known, keeping my job safe while still getting to interact with the public hockeysphere.

I’m back and here to ramble on things like models, sheltering, and environmental impacts on the results we measure.

Continue reading

Behind the Numbers: What Makes a Stat Good

By MithrandirMage [CC BY-SA 3.0], via Wikimedia Commons

Every once-in-a-while I will rant on the concepts and ideas behind what numbers suggest in a series called Behind the Numbers, as a tip of the hat to the website that brought me into hockey analytics: Behind the Net.

Hey! Remember me?

I work full-time for (slash help run) HockeyData, a data tracking and analysis company. Because of this conflict of interest, it limits what I can and cannot talk about. The good news is I can still talk generalities, the basics behind analytical thinking in hockey, and other peoples’ good work, which fits my Behind the Numbers series.

Why have there been so few updates then? Been busy (…lazy).

One generality I’d like to rant about is how we look at and evaluate statistics and models: how meaningful different numbers are and why we view them that way.
Continue reading

Friday Quick Graphs: Update on Predictive Relationships

Screen Shot 2017-05-18 at 1.27.20 PM.png

The above graph is a slight variation of the method employed by JLikens (Tore Purdy) six years ago, almost to the day. The variation being the method I used was extremely simplified. All I did was look at the correlation between each metric for the first 20 games with goals for the next 62 games in the season, with both variables being 5v5 and adjusted for score and home/road venue. I also skipped the lockout shortened season for insufficient games.

Continue reading

Behind the Numbers: Scientific Progress and Diminishing Returns in Hockey Statistics

Embed from Getty Images

Every once-in-a-while I will rant on the concepts and ideas behind what numbers suggest in a series called Behind the Numbers, as a tip of the hat to the website that brought me into hockey analytics: Behind the Net.

As the hockey analytics community pushes for validation of current metrics and their value, I think it is sometimes lost that we do understand these statistics have their weaknesses. We do wish and try to improve upon these weaknesses.

I also think an often underlooked fact is that each incremental improvement diminishes the potential value from every subsequent improvement.

Let’s take a look at what I mean…

Continue reading

Garret’s look back at VanHAC

article_0b66810f-7cc0-4a3b-8614-a64c327f0119.jpg

Hello all,

Josh and I want to off the top thank everyone for making VanHAC17 such a wonderful success. The Vancouver Canucks for hosting, catering, and supplying so much support and resources. Our financial sponsors Canucks Army and HockeyData. Our helpful registration desk volunteers. Our panelists Dan Murphy and Dimitri Filipovic. Our presenters (more on them below). And a huge applause and thank you to our wonderful keynote speaker: Meghan Chayka.

Let me break down how this conference and the weekend surrounding it went from my perspective.

Continue reading

Behind the Numbers: The issues with binning, QoC, and scoring chances

sc1

Every once-in-a-while I will rant on the concepts and ideas behind what numbers suggest in a series called Behind the Numbers, as a tip of the hat to the website that brought me into hockey analytics: Behind the Net.

Almost weekly, you will see a “quant” or “math” type complain about some of the binning going on (usually with Quality of Competition or scoring chances).

But the reason may not seem intuitive, so I’ll use scoring chances as an example and explain the issues with binning continuous data.

Continue reading

Friday Quick Graphs: Marginal Gains for Defenders

Screen Shot 2017-01-20 at 6.59.49 PM.png

Last Friday we asked how many goals is improving a team’s first line worth versus their fourth line? What about defenders?

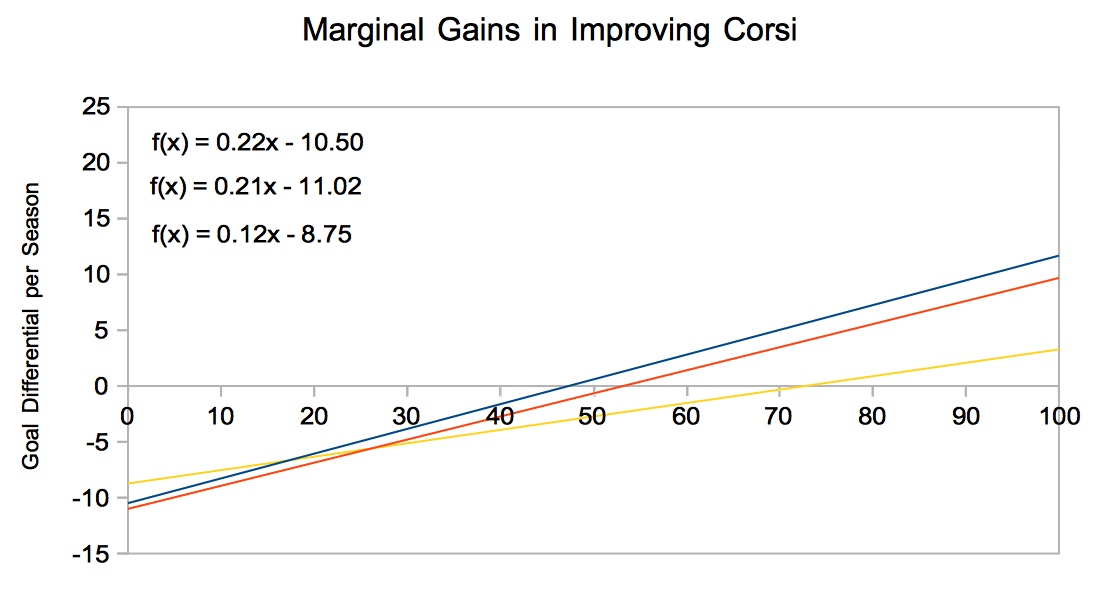
The above graph shows the number of goals over a season a team should expect in improving their player’s shot differential talent, here described in percentiles of talent.

The blue line is first pair with 2nd, 3rd, pairs falling next with red and yellow.

The blue line is the steepest, suggesting that moving from a 55th percentile player to 60th percentile player on the top pair will improve a team’s goal differential more so than a second or third pairing player. (This is not to be confused with improving from a 55% Corsi player to a 60% Corsi player)

Notice how the difference between the top and middle pair is pretty negligible. Improving from an average (median, 50th percentile) to the absolute best in both top and middle pair defenders is only about half a goal difference in improvement. This effect may be due to the fact that teams often place their second best defender on the second pair, whether that may be due to strategy and design or due to handedness “forcing” the team’s hand.

A reminder that the coefficients we found for forwards were 0.24, 0.12, 0.12, and 0.06. This may seem to suggest improvement should be concentrated for top forward line, followed by the top-four defenders, and then middle-six forwards with the bottom pair. However, our method is agnostic of usage and who drives shot differentials more, forwards or defenders.