Using Sequences for Analysis: Expected Goals Contribution and more

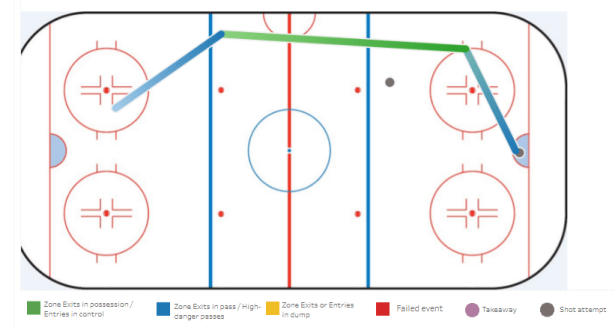
In a previous article, I presented a way to cut and slice a hockey game into Sequences. A Sequence extends from the moment a team gets control of the puck and starts moving forward, to the moment the team loses it for good. The objective was to measure the importance of every event happening between the beginning of a Sequence and its end, from a zone exit to any shot attempts, to a zone entry or any high-danger passes in between. If a Sequence includes one or several shot attempts, its value is the sum of the Expected Goals of all those attempts.

The natural follow-up was the creation of an Expected Goals Contribution metric for players.

The thinking behind it was to answer one of the two main questions we face in the daily use of analytics with coaches: What is the real contribution of each player? Overall, there are the well-known GAR or WAR type of metrics, but these are beyond the comprehension of many staffs as they are not tangible enough for a daily use.

Now, if we use Sequences where the team has possession of the puck, it means Expected Goals Contribution would only look at the offensive side of the game. Still, instead of looking separately at transition or shooting stats to evaluate a player, the objective is to sum all offensive efforts into one metric, weighting those efforts (zone exit, entry, etc.) according to their contribution to the Sequence. It also makes playmaking more apparent statistically.

In other words, it means sharing the total value of the Sequence (in terms of Expected Goals), between the players responsible. This is what we called Expected Goals Contribution.

Continue reading

Introducing Offensive Sequences and The Hockey Decision Tree

If you ever work for a hockey team as an analyst, you could be facing two very recurrent questions from the coaching staff. The first one is very practical: How can analytics help us work better and faster? The second one is: What is the real contribution of each player? Meaning beyond the usual on-ice “possession” stats like Corsi or Expected Goals and individual production metrics such as shots taken, scoring chances, expected goals created, zone exits, entries, or even high-danger passes (passes that end or go through the slot). But those events were not yet statistically linked to each other. Finding a way to provide answers to both questions was my goal for the last few months, and the solution was: I needed to split the game in “Sequences”.

Video coaches often break down game tape to highlight certain plays, such as a rush-based attack or a zone exit under pressure. I wanted to do the same and divide a game in as many parts as necessary, or “Sequences”. Roughly, every time the puck changes possession between teams, a new Sequence” begins. That’s about 250 Sequences per game.

Looking at this from the point of view of the team that owns the puck, offensive Sequences extend from the moment a team gets control of the puck and starts moving forward, to the moment she loses it for good, and it must include a shot attempt in the process to have a positive value. How does this work? Let’s say a player gets the puck back in your defensive zone, you try a zone exit but fail. Sequence starts over, there can only be one exit recorded in the Sequence. So he tries another zone exit and succeed, gets into the offensive zone, the team records a couple of shot attempts, loses the puck and if the other teams gets enough control of it to try a zone exit, it means the end of the Sequence.

How does this help? Well, the basic principle is to see the total value of a Sequence. We’re use Expected Goals as our measure of “value”. To do that, we add the Expected Goals of the shot attempts in the Sequence. For example, a Sequence with two shot attempts:

  • A high danger shot: 0.23 Expected Goals
  • A shot from the blue line: 0.01 Expected Goals
  • Total Sequence value: 0.23 + 0.01 = 0.24 Expected Goals

Sequences

Continue reading

Hockey Talk: Shot Quality

Embed from Getty Images

Hockey Talk is a (not quite) weekly series where you will get to view the dialogue among a few Hockey-Graphs contributors on a particular subject, with some fun tangents.

This week we started from a Twitter conversation suggesting that expected goals calculations (xG) might underweight “shot quality”. A topic that HG contributors are hardly short of opinions on. Continue reading

xSV% is a better predictor of goaltending performance than existing models

This piece is co-authored between DTMAboutHeart and asmean.

Analysis of goaltending performance in hockey has traditionally relied on save percentage (Sv%). Recent efforts have improved on this statistic, such as adjusting for shot location and accounting for goals saved above average (GSAA). The common denominator of all these recent developments has been the use of completed shots on goal to analyze and predict goaltender performance.

Continue reading

Expected Goals are a better predictor of future scoring than Corsi, Goals

newplot

This piece is co-authored between DTMAboutHeart and asmean.

Introduction

Expected goals models have been developed in a number of sports to better predict future performance. For sports like hockey and soccer where goals are inherently random and scarce, expected goals models proved to be particularly useful at predicting future scoring. This is because they take into account shot attempts, which are better predictors of a team and player’s performance than goal totals alone. 

A notable example is Brian Macdonald’s expected goals model dating back to 2012, which used shot differentials (Corsi, Fenwick) and other variables like faceoffs, zone starts and hits. Important developments have been made since then in regards to the predictive value of those variables, particularly those pertaining to shot quality.

Shot quality has been the subject of spirited debate despite evidence suggesting that it plays an important role in predicting goals. The evidence shows that shot characteristics like distance and angle can significantly influence the probability of a certain shot resulting in a goal. Previous attempts to account for shot quality in an expected goals model format have been conducted by Alan Ryder, see here and here

In Part I, an updated expected goals (xG) model will be presented that accounts for shot quality and a number of other variables. Part II will deal with testing the performance of xG against previous models like score-adjusted Corsi and goals percentage.

Continue reading

Scoring talent influence on goal differentials and statistical double dipping

Screen shot 2014-09-09 at 1.20.24 AM

In August, I wrote an article on how you can translate Corsi differential values in terms of the average expected goal differential given for a players of similar average ice time.

In the article, I used an example of how this information could be used:

For example, Matt Halischuk and Eric Tangradi are two players who averaged 4th line minutes on the Winnipeg Jets. Tangradi finished the season with a 53.9% Corsi, while Halischuk was at 44.0%. Over the span of a season, forwards with those Corsi% would be expected to have on average of -1.04 and a -4.77 goal differential respectively. Therefore, on average, a 53.9% Corsi fourth line forward is worth 3.73 goals more than a 44.0% Corsi forward. Another option is comparing these players to the 46.8% Corsi% of an average fourth line player. The goal differentials can then be used to estimate win values using Pythagorean relationships.

There is a caveat with using raw Corsi% to estimate goal differentials; all effects -such as zone starts- still apply. The estimated goal differentials would be no more predictive than Corsi is; however, you can now easily and more accurately measure Corsi impact in terms of goals and wins.

Now, I used the example of Halischuk and Tangradi for a few reasons. The main one being that they are familiar to me as Winnipeg Jets players. They are two fourth line players that have experienced similar usage but have very polar opposite shot metrics. But, there is another reason… an interesting one.

Continue reading