
On Monday, I introduced some work on quantifying and identifying team playing styles, which built upon my earlier work on identifying individual playing styles. Today we’re going to discuss how to make this data actionable.
What are the quantifiable traits of successful teams? What plays are they executing that makes them successful? How can we use data to then build a style of play that is more successful than what we’re currently doing? The way we bridge the gap between front office and behind the bench is by providing data to improve their matchup preparation, lineup optimization, and enhance tactical decisions.
This is what I mean by actionable: applying data-driven analysis and decision-making inside the coach’s room and on the ice. All data is from 5v5 situations and is either from the Passing Project or from Corsica.
The reason I’ll be discussing the Washington Capitals and Pittsburgh Penguins is due to what came out of this article and subsequent narrative surrounding the Pittsburgh Penguins’ ability to defeat the Washington Capitals in their Eastern Conference Semifinal despite being heavily outshot.
.@BombulieTrib Here’s the story where JB addressed the Pens’ rope-a-dope tendencies: https://t.co/FhCof2iJuH
— Bill West (@BWest_Trib) April 30, 2017
How could Pittsburgh win if Washington was the best team during the season and so many people predicted a Capitals victory? You know what is effective at predicting a seven-game series? Very little. To quote Billy Beane from Moneyball: “My shit doesn’t work in the playoffs. My job is to get us to the playoffs. What happens after that is fucking luck.”
It’s not all luck as some would believe, but it does play a large factor in a small sample. The reason why we use the metrics we use is because over the course of a season, they do a better job of indicating which teams are truly better than others. Even then, it still takes nearly a full season for talent to win out over luck with regards to team points. Whether you use score-adjusted shots or expected goals to make your season predictions, they are both strongest at predicting the final season results around twenty-five to thirty games.
However, regarding a short playoff series against the same opponent for four to seven games, we should explore alternatives in order to better explain what is happening that defies our season-long expectations before we go crazy. How can we use data to be better prepared for such a small number of games in a sport more prone to randomness than any other?
I have a few ideas.
First off, I think we need to approach playoffs in an entirely different manner than we do the regular season. I would never say a team “deserved” to win because they out-shot a team in a single game or two. We don’t use shot metrics to predict single-game outcomes. In fact, shot metrics over small samples can be deceiving as far as the quality of those chances. The reason we prefer shot metrics is that over time we would expect the volume to increase the quality of those chances, but over a week or two it’s entirely possible for one team to be taking a lot of bad shots. Things that matter less in the regular season (QoC, matchups, styles of play) likely have greater impact in the playoffs.
It’s important to understand this distinction. Teams that fare better when weighting quantity and quality (see below tweet) generally are stronger teams than by looking at just shots. In fact, Pittsburgh had a stronger season than Washington based on xG.
My xG Power Rankings as of today vs. entering last year’s playoffs pic.twitter.com/jAnVcYyggO
— DTM About Heart (@DTMAboutHeart) March 14, 2017
Let’s take a page out of the NFL’s playbook.
In the NFL, coaches spend hours looking at data and video to understand their opponent’s tendencies and to look for matchups to exploit. The depth of their preparation isn’t feasible during the NHL season due to how many games teams play, and how little practice and preparation time they get. Teams may have different rosters and different coaches later in the season as well, so what they did three months ago isn’t relevant information anymore.
However, once the playoffs roll around, there is much more time to prepare and your opponent isn’t changing apart from call-ups usually near the bottom of their lineup. There is a little bit more of a chess match going on with regards to lineups, matchups, and tactics. In hockey, this is commonly referred as the pre-scout phase and is used before international tournaments. Hockey Canada’s Mat Sells talked a bit about it last year on TSN Analytics.
The narrative began to build that Pittsburgh was playing a “counterattacking style” because they were winning despite being outshot and scoring goals on the rush after heavy periods of Washington pressure. Essentially, people were drawing parallels between the Penguins and Leiceister City, who famously and improbably won the English Premier League in 2016 while playing most of the season on the counterattack rather than a possession-based style. While hockey is a different game, this point is true for both: if you can attack while your opponent is trying to organize themselves, you have a better chance of scoring than if you slowly bring the puck/ball up the ice/pitch and allow them to get numbers into position.
All of this was simmering in my head for a bit last week. Then I remembered these tweets.
Looking at some other data points from this. Have some news for the Caps fans on how they’re playing… https://t.co/rpIX31a2N7
— Ryan Stimson (@RK_Stimp) February 23, 2017
For a deep dive into this analysis, I laid the groundwork here last summer, but Pittsburgh has been the pinnacle of effective transition play over the last two seasons given our dataset (930 games). Washington had a significant increase in this season’s data (see above tweets), tracked by Corey, but remain slightly above average overall. Basically, what teams do following an entry into the zone has a huge impact on their shooting percentage. The reason for this simple: the opposition is defending against the rush, trying to make sure they have the right guy to mark, and everyone is moving quickly.
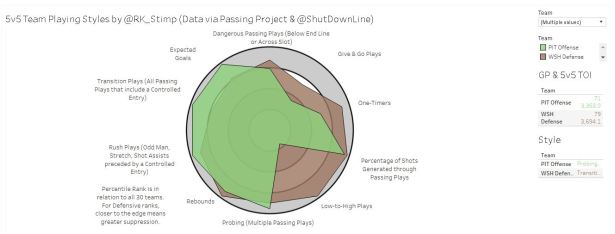
This is a look at Pittsburgh’s offensive style and percentiles on top of Washington’s defensive style and percentiles. You see that Pittsburgh, over the 71 games we’ve tracked, dominates transition, rush, rebound, probing, overall passing, and expected goal metrics.
Pittsburgh didn’t generate these chances by leading all game long either, as they only led the 6th most amount of time at 5v5 over the last two seasons. That certainly contributes to it to an extent, but if they had led 140 fewer minutes over the last two seasons, they would fall to 14th in that same list, so it’s a bunched crowd for sure.
Pittsburgh still ranked near the top of the league in tied situations as well, so, again, it’s not just a score effects thing. While all teams get leads and have the opposition push the pace, very few can create the same chances in transition as the Penguins.
Washington matches up quite well, but it’s very difficult to keep a team from doing what they do best.
Matchups
Above, I mentioned how the playoffs offer opportunity to analyze tendencies of the opposition, what they do well, where they fall short, and things teams can do in games to take advantage of perceived weaknesses. Also, what did other teams do that had success against a team’s upcoming opponent? So, let’s look at how Pittsburgh performed against Washington specifically.
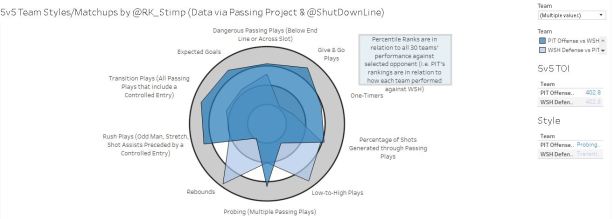
I created a new matchup tool in Tableau that allows you to look at how each team performed against another, as well as how they performed against all teams with a specific style. The percentile ranks are relative to how all other teams performed against the selected opponent. So, in this example, Pittsburgh’s offense is compared how the offense of every team in the league performed against Washington’s defense. Washington’s defense is compared to how well each team in the league defended against Pittsburgh.
Again, our data is from over the last two seasons, so while we don’t have the recent playoff series, we do have last year’s playoff series and some regular season games. It’s fairly clear to see that Pittsburgh, despite their lower shot volume, managed to remain almost as successful in every metric as their total rankings compared to the rest of the league. The only area they didn’t perform well in was rebounds.
We talk very little about Washington’s defense due to how prolific their offense has been, but I think there were signs in our data that this would be a bad matchup for them. Have a look at Washington’s defense against Probing/Rush style offenses.
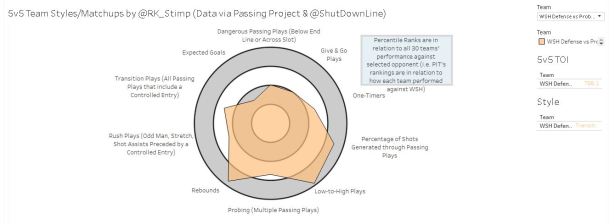
Washington, overall, looks like they had a great defense (see overall style of defense), but struggle mightily against teams that play a style similar to Pittsburgh. They might be average or so against the actual transition and multiple passing plays, but are near the bottom of the league in suppressing expected goals against and dangerous passing plays.
So, did Pittsburgh play a counter-attacking style? They continued to do what they’ve done since Mike Sullivan took over: excel at generating chances in transition and on the rush. My suggestion is that people may be more aware of it now because they of how those games against Columbus and Washington unfolded. A team that is one of the best on the rush will have more chances to execute those plays if they are in their own zone more often. Could Sullivan have done that on purpose? I suppose so, but I think this was just a bad matchup for Washington and you throw in a little randomness to a short series and it’s not completely unexpected.
It can be very easy to chase matchups and get twisted by the small samples of data (teams may only play each other a few times), but I think this offers a better way of analyzing what teams excel at and how teams can better prepare for a playoff series – which is different than how teams prepare for a full season. How a team performs against a style of play can provide insight into how you can matchup with them. What did certain teams do against Pittsburgh that were successful? All this does is expedite that process and make a team more efficient in pre-scouting their opponent. That has value.
In addition to looking at styles of play for teams, we can examine how well each style performed against another, how well each team performed against each team as well as each style overall.
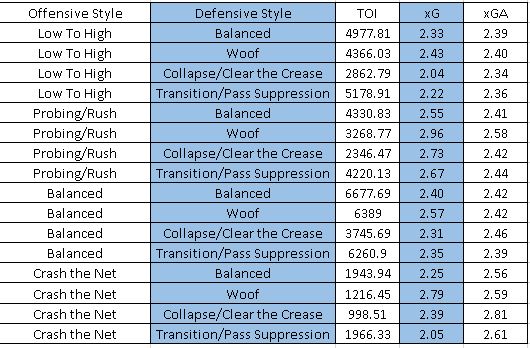
There aren’t too many surprises here, but one think of note was how the “Crash the Net” style was slightly more effective against a “Collapse/Clear the Crease” than a “Balanced” offense was. This would be something to investigate to see if it was something specific or due to small sample size of the former matchup (just under 1000 minutes). But, you can see how this can streamline your preparation.
This does lend weight to adopting a different style or tweaking yours when you come against teams with different defensive styles, however. It’s just you have to know where to look in the data and how much it matters.
Conclusions
Using data analysis to improve and better prepare the on-ice product is where all of my work has been leading. There are far greater tactical discussions to have than “this team should carry the puck in more” and this piece, along with Monday’s, move the conversation forward. Once public data is updated (Corsica is going through some upgrades so some data at present isn’t reliable), I’ll be able to add in how team styles change relative to score state, whether they are home or away, and other surrounding factors.
