
Last month, the NHL Central Scouting Service ranked 401 draft-eligible skaters in four separate categories: 217 North American skaters, 140 European skaters, 31 North American goalies, and 13 European goalies.*
Should we care about this?
On one hand, this is a pretty easy question to answer. From 2011 through 2016, 82.8% of the players selected in the NHL Entry Draft were ranked by Central Scouting beforehand. This result is absurdly similar to the 82.9% figure Iain Fyffe obtained when analyzing 2007-10 Central Scouting ranks. Furthermore, many of the unranked + drafted players were overagers who were ranked + undrafted in previous years. A future post will discuss some of the ways in which Central Scouting doesn’t do a great job when it comes to ordering prospects, but they do seem to pick out most of the notable ones in the first place.
Building a Model
We can start with an even simpler question: do Central Scouting rankings help us figure out which prospects will be drafted? Let’s say it doesn’t matter whether they’re picked 50th or 150th. Can we divide the players up into these two distinct categories based solely on their pre-draft rank? You may be wondering if other factors like size, junior team, point production, age, etc. matter; they absolutely do, and their inclusion will lead to a better model. But let’s try to see how much information we can get out of these rankings alone.
After some intense data cleaning, I created a logistic regression model, and the results are shown below. Based on their Central Scouting rank, each prospect has an associated probability of being drafted. The probabilities are also listed here with the corresponding 2017 prospects.


#1 ranked North American skater Nolan Patrick’s chances of being drafted are close to 100%, which makes sense. More generally, if we say everyone with a fitted probability of > 50% will be drafted and everyone else will not be, we assume the first 126 ranked North American skaters, 29 European skaters, 11 North American goalies, and 5 European goalies will be selected.
A Concern
The multi-colored prediction interval bands already allude to some of the difficulties that we encounter in this analysis. They’re nice and thin for North American skaters, which routinely comprise more than half of all drafted prospects. However, European goalies seem all over the place. A 5th ranked European goalie apparently has anywhere from a 40% to 70% chance of being drafted. Those numbers…are different.
In fact, one of the ways to see this more clearly is to fit draft probability curves for each individual year and see how much they vary.


Again, we see the remarkable consistency in draft probability expectations for North American skaters. Meanwhile, the yearly curves for European goalies paint a picture that’s closer to modern art. This is due to sample size: only a handful of European goalies are taken in each year, so average trends are close to meaningless in this context.
More Concerns
Still, average trends are what we use to predict things. And the easiest way to predict things is to use a 50% cutoff rule. Again, that means we assume everyone with a > 50% of being drafted is drafted, and everyone else is not. How well does that actually work, though? It turns out that 78% of North American skaters, 86% of European skaters, 76% of North American goalies, and 73% of European goalies are correctly classified as drafted or undrafted when using this rule.
That doesn’t seem too bad. But these accuracy rates are based on model predictions for the data that we used for said model, which is a bit sketchy. What we’re more interested in is out-of-sample fit, which we can test by excluding each year from the analysis and trying to predict outcomes based on all other years:
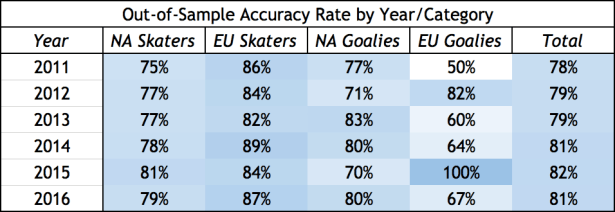
Once again, we see that the rates get more volatile as the categories get smaller. Overall, we still hover around the 80% correct mark, which is what we can expect for the 2017 predictions as well.
Even More Concerns
Here’s a thought: are we being unfair to the model? After all, there’s not a huge difference between a 49% and 50% probability of being drafted, but we treat them entirely differently in terms of predictions. A better measure of how correct the projections are would be to see if the prospects who have an x% chance of being drafted are actually drafted around x% of the time.
The chart below breaks up the projections from all four categories into ten probability buckets (so we have large enough sample sizes for each one) and compares them to actual draft results. For example, all 2011-16 ranked prospects with estimated 40-50% chances of being drafted were actually drafted about 45% of the time.
A closer look shows that the highly ranked prospects were drafted a bit more often than expected, and the lower end prospects were drafted less often than expected. But overall, this is a sensible and encouraging result. In particular, it seems that the prospects listed as coin flips (i.e. in the 40-60% range) were actually coin flips.

Finally (and kudos to you for reading through all these model diagnostics), it should be noted that a 50% cutoff isn’t always the right choice for a classifier. Maybe you care much more about minimizing false positives rather than false negatives. The ROC curve below shows how the true positive rate (the % of positive observations that you classify as positive) varies with the false positive rate (the % of negative observations that you classify as positive). Remember that “positive” in this case refers to the outcome of being drafted.
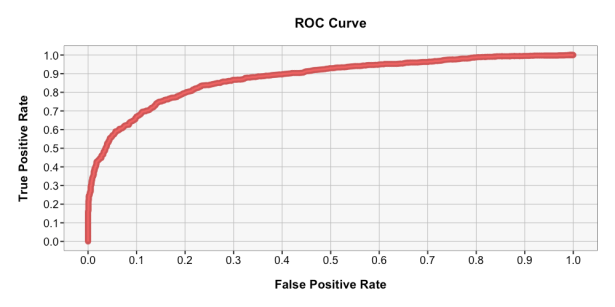
At the 50% probability threshold, we have a true positive rate of 77% and a false positive rate of 17%. But you can move along that curve as you see fit, depending on what’s important to you.
Conclusions
We expect the top 126 North American skaters, 29 European skaters, 11 North American goalies, and 5 European goalies according to Central Scouting to be drafted. Using a 50% cutoff to classify prospects, our predictions are right around 80% of the time. Still, there’s a significant range of prospects for whom you’d do just as well at predicting outcomes if you flipped coins. That doesn’t mean Central Scouting does a bad job, just that we’re dealing with a lot of uncertainty. And that uncertainty is magnified when we try to work with prospects in European leagues and/or goalies.
These results can be bulked up with other predictors and integrated into various draft strategies. In particular, it can help teams judge if and when to select prospects in order to maximize the return on their picks. In fact, the central focus of my work so far is analyzing how teams can use these types of projections to inform draft decision-making.
Some Thoughts on Modeling
There’s an understandable tendency for people to shy away from presenting all of the diagnostics of a modeling approach. In essence, you’re exposing all of the flaws and reasons for people not to trust what you predict. Also, it takes much more time. Creating the model itself took one line of code. Analyzing every inch of it took 75+ lines of code, and that’s for a fairly simple model with one predictor.
But this is an important exercise. There are so many probability-based models out there for all sorts of topics: drafting, team wins and losses, injuries, contracts, etc. It can be hard to intuitively evaluate the performance of these models, and many of the details may be proprietary. But you should absolutely demand some kind of assessment of overall fit before you start allowing them to affect your perceptions and predictions.
Simply put, what a model says is way less important than how accurate and precise we can expect it to be. And if it’s not particularly accurate or precise, that’s an interesting result in and of itself.
*Note that for the purposes of Central Scouting, North American vs. European refers to junior league rather than nationality. This is why you’ll see Auston Matthews tagged as a European skater and Gabe Landeskog listed as North American.
