
Research shows that lateral/”east-west” puck movement in the offensive zone is beneficial to increasing one’s odds of scoring. But I have now heard from people in various positions within the hockey industry on why it might also be useful to generate east-west puck movement in the neutral zone. The theories – focused on lateral passing, lane changes and stretch passes, respectively – all boiled down to one point: When you rush the puck up ice, the defending team will focus on that side, leaving the other side of the ice somewhat more open, so there might be open ice to exploit.
Continue readingPassing Data
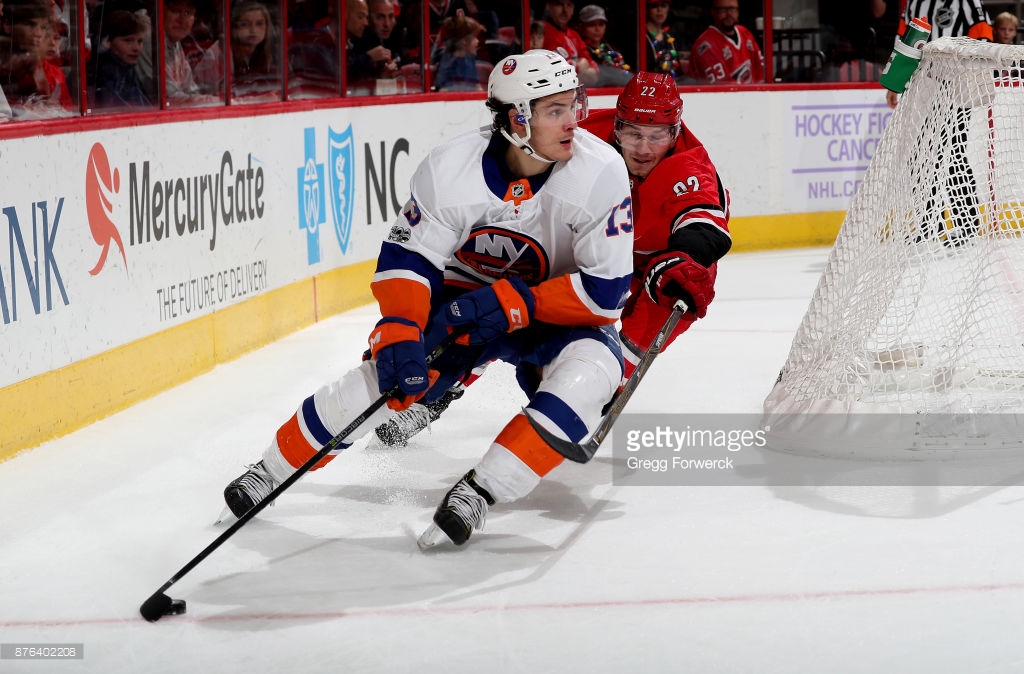
Passing clusters: A Framework to Evaluate a Team’s Breakout
Quick breakouts – trying to move the puck out of your zone right after gaining possession – make up roughly 38% of possessions and account for 22% of all shots and 22.4% of Expected Goals (at least according to my possession and xG definitions). Therefore, understanding what does and does not work when breaking out the puck against present forecheckers is important. There is evidence that passes from the defensive half boards by wingers inside produce more offense than those straight up ice. But the puck is more often recovered elsewhere, so these passes by wingers aren’t the first pass in a possession and are therefore presumably influenced by the previous play. It should be interesting to find out how the inclusion of the pass(es) that came before affects this conclusion.
Continue readingThe Importance of Pressure for a Successful Forecheck
Most of my posts so far have talked about zone exits from the perspective of the team trying to breakout out of their defensive zone. Now, let’s flip the script and discuss the team on the forecheck. This team does not have possession of the puck, but they are in their offensive zone, which is an advantage. So, how can they regain control?
Continue readingVisualizing and Quantifying Passing on the Power Play
Visualizing passes isn’t easy in hockey. In any given KHL game, there are between 700 and 900 Passes. Somewhere between 65% to 85% are successful*. If you wanted to focus on just the successful ones, you’d have to find a way to meaningfully and concisely represent 500-700 events. Let’s start with something simpler: the Power play. If we further restrict our target to passes by single teams during 5v4 power plays in the OZ, we still get between 40 and 50 passes per game per team. Looking at two random KHL games, you can see that this is still quite a lot of passes:

There are some trends to be picked up on, but it’s not very clean. And any semi-serious opposition scouting (especially of special teams) will take into account multiple games, which then leads to an unidentifiable mess when plotted.
Continue readingExpected Goals Model with Pre-Shot Movement, Part 3: 2018-2019 Data
Yesterday we looked at the team and skater results from the 2016 – 2018 data that was used to train the xG model. That’s a pretty robust dataset, but it’s unfortunately a bit out of date. People care about this season, and past years are old news. So let’s take a look at the data that Corey Sznajder has tracked for 2018 – 2019 so far.
Continue readingExpected Goals Model with Pre-Shot Movement, Part 2: Historic Team and Player Results
Intro
In the last post, we introduced a new expected goals (xG) model. It incorporates pre-shot movement, which made it more accurate than existing public xG models when predicting which shots would be goals. However, we use xG models for far more than looking at individual shots. By aggregating expected goals at the player and team level, we can get a better sense of how each of them performs.
Continue readingExpected Goals Model with Pre-Shot Movement, Part 1: The Model
There are few questions in hockey analytics more fundamental than who played well. Consequently, a large portion of hockey analysis has been focused on how to best measure results. This work is some of the most well-known work in “fancy stats”; when evaluating players and teams, many people who used to look at goals scored moved to focusing on Corsi and then expected goals (xG).
The concept of an xG model is simple: look at the results of past shots to predict whether or not a particular shot will become a goal. Then credit the player who took the shot with that “expected” likelihood of scoring on that shot, regardless of whether or not it went in. Several such models have been developed, including by Emmanuel Perry, Evolving Wild, Moneypuck, and many others.
However, there remains additional room for improving these models. They do impressive work based on the available play-by-play (pbp) data, but that only captures so much. There are big gaps in information, and we know that filling them would make us better at predicting goals.
Perhaps the biggest gap is pre-shot movement. We know that passes before a shot affect the quality of the scoring chance, but the pbp data does not include them. Thankfully, Corey Sznajder’s data does. While it does not cover every single shot over multiple seasons, it is a substantial dataset; when I pulled the data for this model, it had roughly half of the 2016-2017 and 2017-2018 seasons included: 72 thousand shots from 1,085 games. While the number of games tracked varies by team, we have at least 43 for every team except Vegas, for which we have 26. We can use this data to build the first public xG model that incorporates passes.
Continue readingAn Introduction To New Tracking Technology
The first significant breakthrough in hockey analytics occurred in the mid-2000’s when analysts discovered the importance of Corsi in describing and predicting future success. Since that time, we’ve seen the creation of expected goals, WAR models, and more. Many have cited that the next big breakthrough in hockey analytics will come once the NHL is able to provide tracking data. We’ve already seen some of the incredible applications of the MLB’s Statcast data and the NBA’s SportVu data. Unfortunately, the NHL has no immediate plans to publicly provide this data and as such, many analysts have decided to manually obtain the data.
Estimating Shot Assist Quantities for Skaters
Hockey fans and analysts have always appreciated the importance of passing. But until the passing project led by Ryan Stimson, we couldn’t quantify that importance. His work supported by a team of volunteers and other analysts has established that the passing sequence prior to a shot is a significant predictor of the likelihood of the shot becoming a goal. His work also showed that measuring shots and shot assists combined as shot contributions is a better predictor of future performance for both players and teams than shots alone.
Knowing that, the logical next step is to use passing data in analysis whenever possible. Unfortunately, the NHL does not provide passing data so it must be manually tracked by people like Corey Sznajder. Corey’s work is invaluable and I encourage you to support him but he’s only one person.
This article attempts to estimate a player’s quantity of shot assists in a given sample using publicly available data to help fill in gaps where tracked data doesn’t exist.
Improving Opposition Analysis by Examining Tactical Matchups
On Monday, I introduced some work on quantifying and identifying team playing styles, which built upon my earlier work on identifying individual playing styles. Today we’re going to discuss how to make this data actionable.
What are the quantifiable traits of successful teams? What plays are they executing that makes them successful? How can we use data to then build a style of play that is more successful than what we’re currently doing? The way we bridge the gap between front office and behind the bench is by providing data to improve their matchup preparation, lineup optimization, and enhance tactical decisions.
This is what I mean by actionable: applying data-driven analysis and decision-making inside the coach’s room and on the ice. All data is from 5v5 situations and is either from the Passing Project or from Corsica.
