
There has been a lot of talk about parity in the NHL lately. Specifically shot attempt parity. The dispersity of corsi for percentage is more centralized this season than any season in the past decade, and people have
https://twitter.com/JeffVeillette/status/856909962680954882
This visualization is hard to read, but if we graph the standard deviations of corsi, expected goals (Corsica), and goals, we can get a pretty good idea of the movement towards or away from parity.

Over the last decade, if we treated the data in a linear fashion, there is a clear direction towards parity (lower standard deviation = higher level of parity). However, the standard deviation of corsi tends to stay in the 2 to 3.5 range. We have seen low seasons before, and high. What is significant about the 2016-17 season is this is the first time since the 2010-11 season that the level of parity (standard deviation of CF%) fell above or below 2 standard deviations of the average season. At that point, we only had three seasons under our belt, so let’s give a little relief to the best season ever played. There is a bit of inception there, but in simpler terms, this season was very unusual. Assuming a perfectly normal distribution, about 95% of seasons would fall within two standard deviations.
Don’t panic yet. This isn’t the stock market. You can’t just assume because you broke through some barrier one time that everything is headed in that direction. The last two weeks of a stock’s movement certainly wouldn’t be reflective of the company’s state of financial health pardoning the case of game-changing news which certainly is not taking place in the NHL. You are better off researching more about the company, going straight to the balance sheets and conference calls, than assuming that because Google is down 3% these last two weeks that they are going out of business.
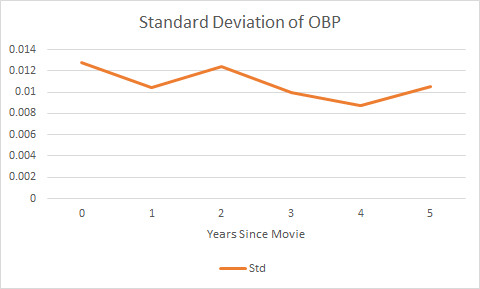
I was listening to Andrew Berkshire’s podcast the other night with the great Garret Hohl. There was a small conversation about parity, and with any analytics conversation, Moneyball came up. Garret mentioned that on-base percentage was an undervalued metric in 2002 and the Oakland A’s took advantage of that. Since 2002, parity of OBP has increased 12% and since the movie has increased if treated as linear.
Moneyball wasn’t about sports analytics at all. Eric Tulsky said it best: “Michael Lewis is a financial writer who particularly likes looking at market inefficiencies and how they get exploited.” For years “possession” metrics have been undervalued by NHL teams. Maybe we are seeing a more efficient market for good “possession” guys, but the Florida Panthers were still able to steal some good players for cheap last summer, so I wouldn’t be too worried.
The simple truth is that no one can predict the future of shot parity in the NHL. It is certainly fun to speculate as long as you understand the limitations of your analysis. So here is why I think parity will decrease next season.
Goal parity is decreasing over time. If we treated the last decade in a linear fashion, the dispersity of GF% is on the rise. Meaning that parity is decreasing. If shot parity is increasing and goal parity is decreasing, we can infer that the amount of unmeasurable talent and/or luck in the game is increasing. This can lead to managers misjudging their players and mismanaging their teams. With the expansion of Las Vegas this year, along with a fairly decent UFA class and a confusing draft, there is a lot of room for good teams to become great, and bad teams to become awful. Even with all the tools we have now, it is becoming harder and harder to evaluate players. General managers will be forced to show their skills this year or lack thereof.
Now this may or may not happen. It’s all speculation. If the standard deviation of CF% falls below 2 next year, we may have serious movement as that would be two years in a row that the level of parity has fallen below 2 standard deviations of the average season. Until the completion of next season we will just have to wait and see. No matter what happens, markets are living, breathing things. Sure the market for shot metrics might be in the process of becoming more efficient, but that is more of the reason to invest in analytics. There will always be an inefficient part of the game, and we must find it and exploit it.

Very interesting. A very crude analysis using corsica.hockey data shows that the correlation between CF% and points% has declined substantially between 2008-10 (3 seasons) and 2014-16 (3 seasons). Conversely, the correlation between xGF% and points% has increased dramatically. My uninformed guess is that some of this is measurement error (particularly for xGF%), but it does suggest that the link between basic shot metrics and results is weakening, and the link between shot location/quality and results is strengthening over time. Could NHL teams be adapting styles to focus more on shot quality than quantity? Of is it just the result of parity impacting the strength of correlations. In any case, I think that analyses that include decade-old data should be viewed with some caution, and some of the standard analyses that were the foundation for the assessment of the performance of Corsi should to be revisited with more recent data.