
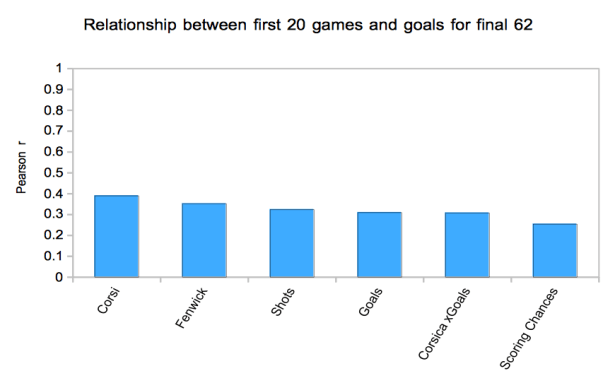
The above graph is a slight variation of the method employed by JLikens (Tore Purdy) six years ago, almost to the day. The variation being the method I used was extremely simplified. All I did was look at the correlation between each metric for the first 20 games with goals for the next 62 games in the season, with both variables being 5v5 and adjusted for score and home/road venue. I also skipped the lockout shortened season for insufficient games.
Corsi led with a correlation coefficient of 0.39, with scoring chances placing lowest at 0.25. Ultimately, as far back as we can go, Corsi at 20 games told us more about which team will perform best at evens for the remainder of the season than any of these other metrics.
The obvious and normal caveats apply: that the relationship exists within the NHL’s current environment and that these are marginal improvements. As I’ve mentioned before, these metrics are not totality but marginal improvements matter.
I should add another caveat that with the variance inherent in goals causes these numbers to highly fluctuate. In 2013-2014 Corsi posted its highest correlation coefficient of 0.72, while Corsi’s lowest was a 0.08 in 2009-2010 (lowest of any metric was -0.13 for Corsica’s xGoals in the same season). All these metrics vary year-to-year, so one should be careful to not be fooled by the potential randomness in “trends” of any particular direction.
