
It’s been a crazy couple of days writing up this general manager project. If you haven’t already, please read the methodology before checking out our final list of rankings.
When going through the final rankings there were several interesting things that only show up when the data is viewed holistically. Here are some of our big findings that didn’t make it into the rankings piece.
1. GMs Aren’t As Bad Or Good As They Seem (Usually)
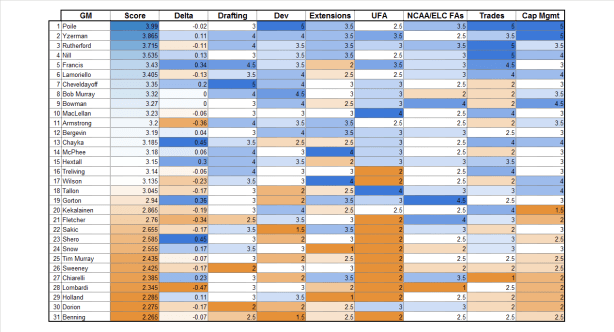
The standard deviation of the overall ranking is 0.48, with a mean of 3.0 (which follows since this was a 1-5 scale). That means only four GMs made it into the “extremely good” section of the rankings, and just seven in the “extremely bad.” And two of those seven have already been relieved of duties.
This means two-thirds of the GMs ranked fall within the “normal” parameters, and eighteen are above our “average” rating. Not to mention, there is some extremely tight clustering of several GMs.
No. 9 (Bowman) to No. 14 (McPhee) is all within 0.1 points. No. 15 (Hextall) to No. 17 (Wilson) is all within 0.015 points. Gorton (No. 19) missed the 3.0 mark by just 0.06 points.
As we mentioned in Part 1, we hope the big takeaway here is that the spread between GMs is very small. They each have areas of strength, and areas of weakness.
Much like player skill sets, it might be worthwhile for owners to pin down what they think they need the most in a GM when hiring, then ensure that GM builds a staff that can help compensate for their weaknesses.
Just like winning on the ice, managing a successful front office is a team effort.
2. Yes, We Disagreed (But Not Much)
On the chart above, the “Delta” is where our ratings disagreed. The darker blue a number is, the more Carolyn liked him, the darker orange, the more Chris favored them. Our Standard Deviation, though, was 0.23, meaning usually we were within a quarter of a point of each other.
This is good, as it shows that we likely used similar, logic-based approaches to our ratings.
Carolyn’s big deltas were with John Chayka and Ray Shero, showing she likely gives a lot of the benefit of the doubt to rebuilding clubs. Of course, she’s known to be hard on Dean Lombardi, which was Chris’ biggest delta.
Chris was also much higher on Doug Armstrong, which was a bit surprising for a confessed Blackhawks fan.
Most interestingly, they had perfect, or nearly perfect, agreement on Bob Murray, Stan Bowman, David Poile, Brian MacLellan, Marc Bergevin, George McPhee, Brad Treliving, Tim Murray, and Jim Benning. These GMs crossed the spectrum of very good to very bad, so it doesn’t appear to be any easier to identify one than the other.
3. Hockey Graphs Survey Results
Best Drafters:
Yzerman, Poile, Cheveldayoff
Worst Drafters:
Benning, Sweeney, Lombardi
Best Player Development:
Yzerman, Poile, Bob Murray
Worst Player Development:
Tim Murray, Sakic, Bergevin, Benning
Best with Extensions:
Yzerman, Poile
Worst with Extensions:
Benning, Bowman, Lombardi
Best with NCAA and College FAs:
Gorton
Best with UFAs:
MacLellan, Rutherford
Worst with UFAs:
Sweeney, Sakic, Chiarelli, Benning
“This guy is a genius but also an idiot” Votes
Stan Bowman – Managing the Cap (19% best/38% worst)
4. Surprise, Surprise
One of the biggest surprises was just how hard this exercise was. It’s easy to do a quick power ranking, even a statistical one, because all the information is generally in one place. But reviewing four years of deals and drafts across multiple sites, and then having to weight one trade or extension against another to come up with a single number rating?
It was tougher than expected, and it forced us to confront some of our own biases. But it was also fun, because we learned a bunch in the process.
As far as outcomes are concerned, Poile was a surprising No. 1. Good money would have had it on Rutherford (most recent Cup champion) or potentially Yzerman (king of extensions), and while they did score well, Poile was still head and shoulders above.
Joe Sakic was another surprise, coming in above the “extremely bad” line, even after heading up a historically bad year. While the weight of his GM history is, well, not good, his recent moves likely pushed him up out of the danger zone.
However, (according to our Twitter feeds) the most contentious ranking was that of Kevin Cheveldayoff, the GM of the Winnipeg Jets (which we saw coming from a mile away). The Jets have broken the hearts of their fans and prognosticators who don’t understand why their on-ice talent doesn’t translate to wins and playoff appearances. (*Cough*, *Ondrej Pavalec*, *Cough*).
Nevertheless, even before picking Calder finalist Patrik Laine with the No. 2 pick last year, Chevy hit on all 5 of his previous first round picks without picking in the top 5 (Scheifele, Trouba, Morrissey, Ehlers, Connor) and has built a potential powerhouse in one of the league’s smallest markets. Whether he deserves to see it through is another question altogether.
5. Interesting Miscellany
Of all the categories, Drafting had the highest average rating by far, coming in at 3.32. This is good, as it was also one of our most important categories.
Unsurprisingly, UFA Signings had the lowest average rating, at 2.63. This means that your average GM does a poor job getting value in the free agent market. That underscores just how important Drafting and Development are to building a good team.
One concerning average would be that of Extensions, which came in at 2.85. While close to average, it is under that 3.0 score, indicating there is a significant weakness in identifying the proper value for players currently on a roster.
One other important thing to note was that the timeframe we chose (post 2013 CBA signing) did dramatically alter some GMs rankings. Some of Chuck Fletcher’s best drafts came from 2010-2012, where he picked up Mikael Granlund, Jason Zucker, Jonas Brodin, and Matt Dumba. Even Tyler Groavac, while not an impact player, was taken in the 7th round of 2011, and has racked up 57 games. Few 7th round picks can claim even one.
And of course, the timeframe means that Lombardi’s most famous trade, you know the one we’re talking about, wasn’t included. Even Carolyn would have to (grudgingly) admit that worked out in his favor.
As such, it became clear that public opinions of GMs can be extremely fluid, as few people would have ever considered Ken Holland a bottom five GM in 2008. You either retire a hero, or sign enough bad extensions to see yourself become a villain.
All in all, this was a beast of a project. Hopefully, our methodology made sense, and our evaluations didn’t feel ridiculous. While it remains impossible to remove subjectivity from a project like this, it’s still a worthwhile endeavor.
And who knows… in 2018, this list could look completely different.

How were the extraneous factors of the draft lottery taken into consideration when ranking the draft skills of each GM? Also, did you cosider separating draft prospects by individual GM’s tenure? In other words, are newer GM’s being graded on the successes and failures of the previous administration?
Interesting analysis. Good read!
We did our best to grade each GM only on their tenure. Development was the main category where you could see some crossover, as guys a previous GM had drafted would then be shifted to the new GM’s “developing players”.
As far as the draft lottery goes, we tried to grade based on “did they get the best player they could” for the pick they had. The best example is Sweeney’s 2015 draft. He could’ve gotten Barzal, Connor, and Kylington, but he chose guys who were consensus second-rounders.
Wow, that’s some great work! Thanks for the reply, really appreciate it. 🙂
It’s awesome to see your GM Report posted as it’s a hugely daunting task with so many subjective conclusions, so my hat is off to you! The only comments I would make on your rankings are that the only objective way to measure GM’s is to measure historical results rather than that what could be. It’s dubious to me to measure what a player could be when you can measure what they have actually become and give credit at that point. You cite an example of Don Sweeney and the 2015 draft, but why don’t we let that draft year pan out before giving or taking credit away. I’d like to see certain point values attributed to draft picks the team picks with and then top up that point value with what role that player becomes no matter the team (top line, top six, fourth liner, top pairing, top four, seventh d, starting goalie, backup, AHL player, etc.) The same could be said for any acquisition and some sort of level field would have to be established before anyone judges an over payment/great signing on a UFA or RFA signing/extension. Obviously actual team performance is the biggest bottom line for a GM and that needs to be measured as well but then you’re punishing GM’s that are fairly new to the job, so how to compare? I think it’s a little complicated to rate a GM out of 5 and would love to see a larger point value attributed to each GM so that you could drill down on and see how each value was calculated. Sorry for the long post, but you got me excited 🙂
As far as your point re: the draft and how talent pans out, that’s why we split it into two categories.
The first is drafting accuracy – did they get the best prospect they could with the pick.
The second is development – which is turning picks (no matter how accurate they are) into NHLers.
Some GMs rank well in one but not the other.
Yes, newer GMs (Chayka, Dorion) definitely are at a disadvantage in this ranking, as are some who were left with big messes to clean up. But that’s also just the way life goes.
I think what we’ve done is a good first stab at attempting objectivity, but do encourage others to try and build out their own rankings.
Thanks for the response. I guess my point is that you maybe don’t have to split it out as the only thing that matters at the end of the day is the draft picks developing into NHLers and what level of player they become. It doesn’t matter if they picked who was perceived to be the best prospect at the time as that means very little except for PR and those that take great pride in prognosticating talent. That drafting accuracy category is the biggest subjective in your ranking and I understand where you’re going as not many people would say that Dylan Strome is a failed pick at this point and why would Sebastian Aho give his GM more marks at this present time, etc. You’ve made a great first stab and I hope you continue to expand on it. 🙂
I disagree. If you pick well, you can trade prospects for “win-now” pieces, but it will damage your development pipeline. The new GM would get credit for that prospect turning into an NHLer, but that doesn’t mean the drafting GM did a bad job. They deserve credit for picking well.
I think you’re actually agreeing with my point, that it doesn’t matter what team the player actually develops on to score a great draft record. Look at a trade like Jarome Iginla for Joe Nieuwendyk for example. No one knew that Iginla at the 11th overall pick was actually the best pick in that draft and that Bob Gainey either got incredibly lucky or had a stroke of genius, but then traded him away for what was an established front line player who was 29 years old at the time and never reached 40 goals again in Dallas but still played over 400 games for them. This is the very trick part for anyone to put a value on the GM’s involved at that time. Gainey made an incredible draft pick, got good value for the trade, but Al Coates in Calgary made an incredible trade. Easier to score now, but in 1995 to 2005 not so much. To eyeball it quickly in hindsight I’d give Coates a 100/100 and Gainey a 90/100 but it wouldn’t be to difficult to come up with an objective point system for the trade and the draft pick.
I disagree, although I don’t know which/who’s pre-draft rankings you are comparing the GM’s picks against. If a GM has the correct read on a player despite the armchair GM’s ranking system having a player lower or higher, he is therefore scored low on drafting and high on development, when he really should be high in both categories. The problem with this rating system (as I see it currently, correct me if I am wrong) is it rewards GM’s who scoop up higher ranked players cause they have fallen to them, when other GM’s may have correctly determined the player was ranked too high in comparison to publicized draft rankings.
Anyways fun to see and I imagine an insane amount of work went into this, congrats and thank you!
Sorry to clarify I was agreeing with Gambler, disagreeing with Carolyn!
Curious how Nino affected Snow’s player development column. I assume good pick, bad trade (Clutterbuck). Had a terrible, terrible rookie season for Islanders, went to AHL, then was traded and had a good season for Wild. Is Snow credited or faulted for player development, in this case? If faulted, does that mean the Clutterbuck trade wasn’t as much of a black mark?… Griffin Reinhart is a bit of the opposite. Bad pick, good trade (Barzal and Beauvillier, pretty much), but how does it affect player development?… Fun article!
Since we attempted to look at things ‘on balance’ Snow’s average score includes trading away guys like Nino, but also includes successes like Strome and Ho-Sang. One major black mark, several smaller wins, all adds up to an average rating.
Unless a single trade was overwhelmingly good or bad, it generally didn’t affect a the Trade rating so much – again, looked at everything from ’13 on. As far as that particular trade affecting Player Development score, I would say it had a bigger effect on Drafting, as those were really good picks. Barzal was still in juniors this year, which means I didn’t really look at him for PD (unclear if he’s a long-term NHLer), and Beauvillier was in and out of the line up.
Thank you for explaining. Yes, it seems difficult to separate drafting from development.
Sorry for being late to the party with this comment. This analysis is fascinating.
As a Hurricanes fan, I’m struggling to reconcile the ‘Cane’s league worst 8 year playoff drought with the high rankings of the current (Francis) and former (Rutherford) GMs. I know wins and playoff appearances aren’t always an accurate way to evaluate a team’s success. But 8 years seems like enough time to build a large enough sample size to evaluate success based on wins, and enough time for the GM to get better talent. In a league that sends over half of its teams to the playoffs each year, making the playoffs seems like a pretty low bar to clear, and an 8 year playoff drought seems pretty terrible. The Hurricanes have been a trendy pre-season pick to perform better than everyone expects for the last 2 or 3 years, but haven’t been to the playoffs yet.
To be fair, Rutherford was fired in 2014, which was just a year into the time period analyzed here. I guess Francis has been building the team since then, but it’s frustrating to wait so long for all of these ‘smart moves’ to translate into an appearance in the playoffs.
Yeah, there are a couple things you’re noticing that definitely had to do with methodology.
1) Timeframe. Any GM who hasn’t been in place for the entire timeframe may get an unfair advantage — or disadvantage
2) We didn’t use playoff/standings results in our rankings at all, despite those results being absolutely crucial to GM job security. Why? Because there are just too many factors that can’t be directly attributed to a GM’s actual decision-making.
That said, I agree. You absolutely do need to weigh results when you’re evalutating a GM — at least in the hire/fire sense. But ultimately, in an exercise like this, it was hard to point to the standings and say “yes, this GM caused it.” We did use the GAR rating as kind of a “sanity” check, though, and it lined up pretty well.