
Last time, I looked at individual playing styles by clustering players together based on various passing metrics. Today, I’m going to use a similar approach to identify team playing styles and what we can learn about them. I got the idea watching this video on NBA offensive styles (stick tap to @dtmaboutheart for the link). It’s been sitting in my unfinished pile for a while, but I was spurred on to finish it by some comments made about the Washington Capitals and Pittsburgh Penguins series, which I will delve into tomorrow. Today’s piece is to going provide examples of how passing metrics can provide more detailed and actionable scouting reports for a team’s offensive and defensive tendencies.
All data is form 5v5 situations and is either from the Passing Project or Corsica.
Styles of Play
Similar to the player piece, indexes were created combining the rate of various passing plays as well as the percentage make-up of a team’s offense or defense by that particular play. So, if a team generated five stretch pass plays per sixty minutes and these made up eight percent of their offense, we’d multiply them together to normalize for the team’s playing style.
For example, the Los Angeles Kings generated 4.7 dangerous shots (shot following a pass from below the end line or across the slot) per sixty minutes and the New Jersey Devils generated 3.9 of these same plays. The Kings generated more, correct? Yes, but due to the discrepancies in shot volume, 8.8% of the Devils offense was made up of these passing plays, compared to only 7.4% of the Kings. When we multiply them, we arrive at an index that accounts for volume and playing style. The Kings and Devils had the same index for this metric.
Metrics
Below are the various metrics I’ve come up with to quantify how teams attack. The percentage after the name is the conversion rate of one of these plays. The conversion rate is for all shooting attempts. Non-passing plays convert 3.2% of the time for comparison. Some of these categories will overlap with another – for example, a Danger Zone pass could also be a Give & Go play. The sample is all of our data over the last two seasons; St. Louis has the fewest number of games tracked at forty-two, everyone else is above that.
- Danger Zone Passes (10.3%, shot following pass from below the end line or across the slot))
- Give & Go Plays (5.8%, shooter is also the secondary passer in the sequence)
- One-Timers (4.8%, puck shot immediately upon receiving the pass)
- Passing Offense (this is simply how much of a team’s offense is from passes rather than non-passing shots)
- Point (1.6%, puck passed back to blue line preceding shot)
- Probing (10.9%, these are multiple passing sequences that result in a scoring chance from inside the home plate area)
- Rebound (13.5%, shot from inside home plate area following initial shot from passing sequence)
- Rush (10%, isolating transition sequences that are odd-man situations, stretch plays, or controlled entries followed by another pass)
- Transition (5%, all passing plays involving a controlled entry)
- xG (this is where the team fell in terms of expected goal creation/suppression based on this)
Most of these metrics are familiar to my readers, but there are few new ones that I want to briefly highlight.
- Give & Go plays are things everyone knows when they see it – a teammate passes to another, cuts to another place on the ice, and receives the return pass. This is a quick way to bypass the opposition into some open ice if the passes are tape-to-tape. Naturally, these plays have a higher shooting percentage and are nearly the same as plays originating behind the net.
- Probing plays represent a more patient and/or willingness to pass the puck rather than settle for a shot. A single pass often opens up a good chance, but another pass improves your odds of scoring significantly. Teams that work the opposition in order to manufacture a scoring chance see these chances go in much more often than if they had settled for the first shot opportunity.
- Rush plays are the transition plays that are the most dangerous: odd-man situations, stretch passes, and passing upon entry of the offensive zone. All of these plays have elevated shooting percentages due to the situation they assert upon the defending team.
You can access a Tableau of where each team falls, both offensively and defensively, in terms of playing style. Teams are ranked based on percentiles for each metric. It’s a quick way to see how teams attack and where they don’t defend well.
All metrics except for the xG rates were thrown into the clustering model to assign both offensive and defensive playing styles. The reason xG was excluded was because it would have simply grouped teams based on their xG, which isn’t really what I’m going for. I want to group teams based on style of play so the frequency and percentage of different plays are what we’re after. I include the xG on the Tableau to provide a measure of “how good was this team at executing this style” to offer a weight to each team’s play.
The Results
Let’s do offense first. Below are the number of teams in each cluster (there were once again four groupings), the average percentile in each metric, and the arbitrary name I’ve given each group based on their percentiles.

These four styles of play were named based on where they stood out in terms of percentiles of various play types. The Low-to-High group was easily named as it was really the only metric these teams excelled at on average. However, that was not always the case as the San Jose Sharks are in this group due to Pete DeBoer loving passes back to the point and looking for high tips in addition to passing and playing behind the net. Since they were in the 100th percentile for plays to the point they were put in this group, but they likely deserve to be in another. Like many analytical tools, this is a starting point for further analysis into how teams attack – it simply expedites the process.
The Probing/Rush group excelled at creating odd man situations, shot assists off of controlled entries, and stretch passes. They also regularly created scoring chances off of multiple passes. This implies a team is quite good at dictating to the opposing defense and working their coverage for openings, among other things.
A balanced team was around 50% in all categories, some above and some below. The only thing that stood out was the one-timer percentile. I’m not quite sure what this means, if anything at all.
The Crash the Net group was for the offensively inept. There’s no indication they generate rebounds or anything that lends credence to the name; I simply thought of a coach telling his or her team to crash the net when they are out of ideas. Given the lack of success in this group, they all seem like coaches or team analysts without many ideas.
And now let’s look at the defensive styles of play.

I know. “Woof” isn’t a style of play, but I couldn’t think of anything that articulated my initial reaction to this group of teams better than “woof.” These are some terrible teams as far as shot and goal-suppression go. Most of the usual suspects are here, but also feature ones that perhaps may be surprises to some.
There’s always a Balanced category because some teams are good at most things, and don’t excel or under-perform. The Collapse/Clear the Crease group defends exceptionally at plays across the slot or from behind the net, and are above-average at denying rebound chances, so that seemed like an appropriate label. The last group is the best and it involves suppression of passes and multiple passing sequences, as well as good neutral zone defense in eliminating rush and transition plays.
You will notice a closer grouping of xG among defensive teams, further suggesting that what separates teams from good to great is what they do, and the talent they have, on offense.
Examining Styles
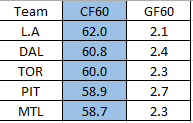
Here’s the top five teams by shots for over the last two seasons. I’ve also included their goals for rates for comparison.
Now, we’ll look at some of their playing styles on top of each other.

There is Dallas’s offensive playing style overlaid over LA’s. Over the last two seasons we’ve collected 68 Stars games and 44 Kings games. You can see that while both are high in expected goals, that changes quite quickly when you look at expected shooting percentage: Dallas was at 4.7% and L.A. at 4.1%. The Kings score through volume and a style that doesn’t lend itself to creativity or smart puck movement.
@RK_Stimp I was doing a Kings game the other day. They don’t pass, like at all.
— Corey Sznajder (@ShutdownLine) April 25, 2017
The Kings are a “one-and-done” passing team. They get pucks to the net quickly, often after dumping it in, retrieving it, making one pass, and then shooting. They are one of the least-creative teams in the league.
If a team’s roster is set, but they are starving for goals and can’t count on regression to the mean for better scoring in the future, evaluating and tweaking their style of play is one avenue that remains unexplored by hockey analytics – until now that is. How might this improve a team’s fortunes? Let’s again look at the expected shooting percentage of the two teams above. Over the last two seasons, the Kings averaged a little over 4000 shots a season. We would expect 164 goals at 5v5 from that output. If the Kings adopted a style similar to the Stars, we would expect 188 goals, an improvement of 24 goals. At 4.8 goals per win, that’s an improvement of 5 wins, or 10 points. They missed the playoffs by 8 points, so it certainly has practical applications as far as a way data analysis can be used to improve a team’s performance when trades and new signings cannot be made.
In fact, the Kings may have realized this when they made their coaching change. If only they had called me when I wrote about it a year ago. Each team should have their video coach and/or analyst (or a new position like “tactical analyst” or something? I’m available by the way) doing this already.
From a few days ago and from last July pic.twitter.com/XbayBAAnWq
— Ryan Stimson (@RK_Stimp) April 25, 2017
Despite Dallas and L.A. both being at the top of the shot chart, they approach it quite differently, with wildly different outcomes that make sense when you break down how they generate offense. That’s really the key thing, you wouldn’t be able to identify any of this by looking at a shot chart. If you tried to fix your offense by looking at shot plots of where shots occurred, you’re not even looking at the problem. You need to be able to quantify, measure, test, and understand how shot sequences are created if you want to optimize your team’s performance or suppress the opposition’s.
It can be as something as small as encouraging our team to quick up and mix in both lane and motion regroups if we know the other team defends poorly in transition or against the rush. We can also put emphasis on working the puck below the end line each time we recover a loose puck in the offensive zone if the opposing team struggles at suppressing those plays. The same logic and methods apply to defensive styles.
So What?
Not only does this provide insight into exactly what areas of a team’s offense and defense need work, but it helps build a roadmap to answer questions like, “How can create more offense in transition? What teams are doing that we can look at? How can steer teams back to the point? What teams excel at doing that?” It won’t have all the answers, as nothing ever does, but it is another tool to allow you to begin to tackle these questions with greater evidence and insight.
When preparing for an opponent, specifically a playoff series, this data can reveal tendencies related to how a team attacks or defends. What are they likely to do? How can we prepare more efficiently? What styles are better matchups versus another? In tomorrow’s piece, I’m going to show some practical ways we can use this data to prepare for matchups.
