
Welcome back to The Hockey-Graphs Podcast! Our second episode showcases Namita Nandakumar‘s recent articles; Exploiting Variance in the NHL Draft and Who’s Getting Drafted This Year?. Namita and Adam discuss: draft theory, risk aversion, player potential, central scouting rankings and how to best apply her research moving forward. Any comments are appreciated, the goal is to produce a podcast that people want to hear. Please subscribe to the podcast on iTunes!
FQG: Cumulative Hits in the Conference Final

Throughout the playoffs (quarterfinals, semifinals), I have analyzed whether a team’s hits for and against were indicative of their success. Studying a team’s Corsi for percentage per game and expected goals for per game alongside their cumulative hits can help us spot high-level trends.
We’re seeking to determine the accuracy of the narrative that many hockey traditionalists love – that a team must increase their hitting to succeed in their quest for the Stanley Cup. This has been studied in recent seasons, including 2014-15 season, 2015 playoffs, and 2016 playoffs, yet no decisive correlation was found between a team’s increased hitting and success. So far in the first two rounds of the playoffs, this seems to hold true.
Should teams play with 4 forwards when they’re down late?
Embed from Getty Images
Tl;dr
- There is some evidence to suggest that teams should play with 4 forwards when trailing late in a game.
- The timing of when to switch to 4 forwards is dependent on how large an impact the switch has on goal scoring rates, however even with a low impact on goal scoring, using 4 forwards still makes sense.
One of the weird things about sports that I find fascinating is how often coaches and players seem to go out of their way to avoid having a negative impact on the game, even at the expense of potential positive impacts. People often seem to prefer to “not lose” rather than to win, which can result in sub-optimal decision making, even in the presence of evidence to show that the correct decision is not being made.
There are many examples of this across sports, but the biggest two in hockey are pulling the goalie and playing with 3 forwards on the power play. Analysts have been arguing for many years now about why teams should pull their goalies earlier, but it’s only been in recent seasons that teams have become more aggressive in getting their netminders out earlier.
Who’s Getting Drafted This Year?
Last month, the NHL Central Scouting Service ranked 401 draft-eligible skaters in four separate categories: 217 North American skaters, 140 European skaters, 31 North American goalies, and 13 European goalies.*
Should we care about this?
Friday Quick Graphs: Update on Predictive Relationships
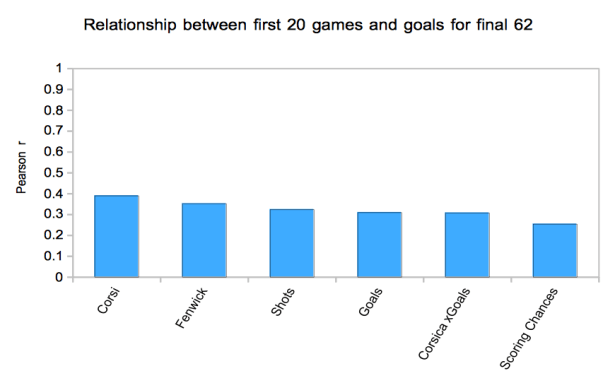
The above graph is a slight variation of the method employed by JLikens (Tore Purdy) six years ago, almost to the day. The variation being the method I used was extremely simplified. All I did was look at the correlation between each metric for the first 20 games with goals for the next 62 games in the season, with both variables being 5v5 and adjusted for score and home/road venue. I also skipped the lockout shortened season for insufficient games.
The Hockey-Graphs Podcast Episode 1: Team Play With Ryan Stimson
Welcome to The Hockey-Graphs Podcast! Our first episode showcases Ryan Stimson‘s recent article; Identifying Team Playing Styles With Clustering. Ryan and Adam discuss: how the piece came about, the methodology of the clustering, the pros and cons of each individual cluster and how to use this data to better team results. Any comments are appreciated, the goal is to produce a podcast that people want to hear.
Reach out on Twitter! The podcast will be on iTunes within the next few weeks, until then please listen through Soundcloud!
How Indicative are hits in the 2017 Stanley Cup Playoffs: Semifinals
After the conclusion of the 2017 Stanley Cup Quarterfinals, I looked at whether a team’s hits for and against were indicative on their play. By looking at a team’s Corsi for percentage per game and expected goals for per game, against their cumulative hits as their first round progressed, it could be observed whether a team’s production dropped due to being outhit.
As it was explained in the first part of this series, many hockey traditionalists point to an increased number of hits as a necessity to compete for the Stanley Cup. There is a preconceived notion by some hockey minds that a team will become worn out if they are consistently outhit in the playoffs and subsequently will not be able maintain their production. However, in the 2014-15 season, 2015 playoffs, and 2016 playoffs, no decisive correlation was found between success and hits.
Improving Opposition Analysis by Examining Tactical Matchups
On Monday, I introduced some work on quantifying and identifying team playing styles, which built upon my earlier work on identifying individual playing styles. Today we’re going to discuss how to make this data actionable.
What are the quantifiable traits of successful teams? What plays are they executing that makes them successful? How can we use data to then build a style of play that is more successful than what we’re currently doing? The way we bridge the gap between front office and behind the bench is by providing data to improve their matchup preparation, lineup optimization, and enhance tactical decisions.
This is what I mean by actionable: applying data-driven analysis and decision-making inside the coach’s room and on the ice. All data is from 5v5 situations and is either from the Passing Project or from Corsica.
Identifying Team Playing Styles with Clustering
Last time, I looked at individual playing styles by clustering players together based on various passing metrics. Today, I’m going to use a similar approach to identify team playing styles and what we can learn about them. I got the idea watching this video on NBA offensive styles (stick tap to @dtmaboutheart for the link). It’s been sitting in my unfinished pile for a while, but I was spurred on to finish it by some comments made about the Washington Capitals and Pittsburgh Penguins series, which I will delve into tomorrow. Today’s piece is to going provide examples of how passing metrics can provide more detailed and actionable scouting reports for a team’s offensive and defensive tendencies.
All data is form 5v5 situations and is either from the Passing Project or Corsica.
Stop Worrying About Shot Parity
There has been a lot of talk about parity in the NHL lately. Specifically shot attempt parity. The dispersity of corsi for percentage is more centralized this season than any season in the past decade, and people have
https://twitter.com/JeffVeillette/status/856909962680954882
This visualization is hard to read, but if we graph the standard deviations of corsi, expected goals (Corsica), and goals, we can get a pretty good idea of the movement towards or away from parity.

