

Throughout the playoffs (quarterfinals, semifinals), I have analyzed whether a team’s hits for and against were indicative of their success. Studying a team’s Corsi for percentage per game and expected goals for per game alongside their cumulative hits can help us spot high-level trends.
We’re seeking to determine the accuracy of the narrative that many hockey traditionalists love – that a team must increase their hitting to succeed in their quest for the Stanley Cup. This has been studied in recent seasons, including 2014-15 season, 2015 playoffs, and 2016 playoffs, yet no decisive correlation was found between a team’s increased hitting and success. So far in the first two rounds of the playoffs, this seems to hold true.
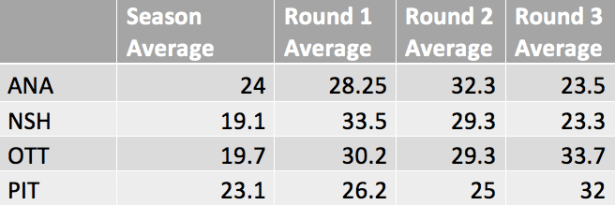
One aspect of the traditionalist narrative appears to have held through the Conference Final: teams have substantially increased their hitting in the postseason as compared to the regular season, as shown above. Next, we can dig deeper into each Round 3 series.
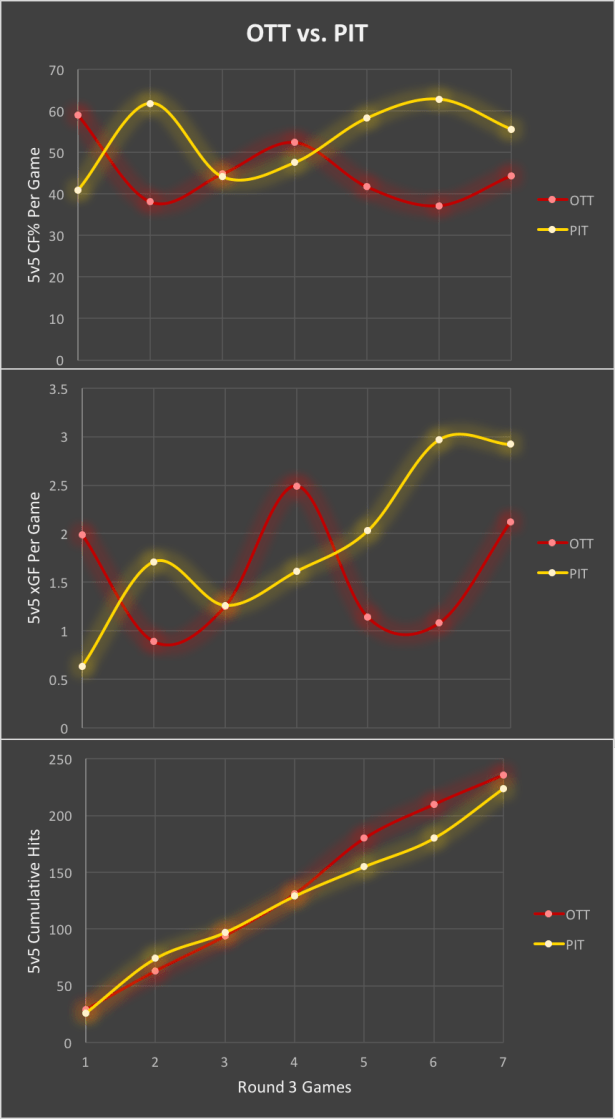
The Penguins have consistently been outhit throughout these playoffs, up to and including Round 3. In contrast, their CF% per game increased from the series’ start to finish – as did their xGF per game.
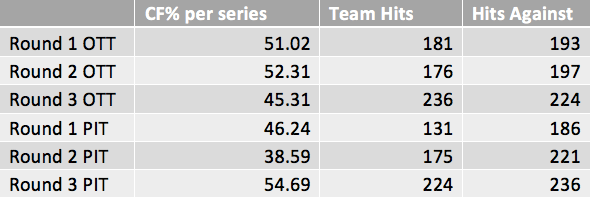
In theory, the Penguins should have felt worn out and decreased production because they were outhit throughout the playoffs. The Penguins did have their highest number of hits for and highest series CF% in the Conference Final. However, there has not been a clear pattern throughout their playoffs that shows a link between increased hits and CF% per series.
The Ottawa Senators were also outhit until the Eastern Conference Final, where they were eliminated. In this series, their CF% for the series was the lowest of their playoffs, dropping as their series against the Penguins progressed, while their xGF varied throughout, eventually ending slightly higher than it was in Game 1.
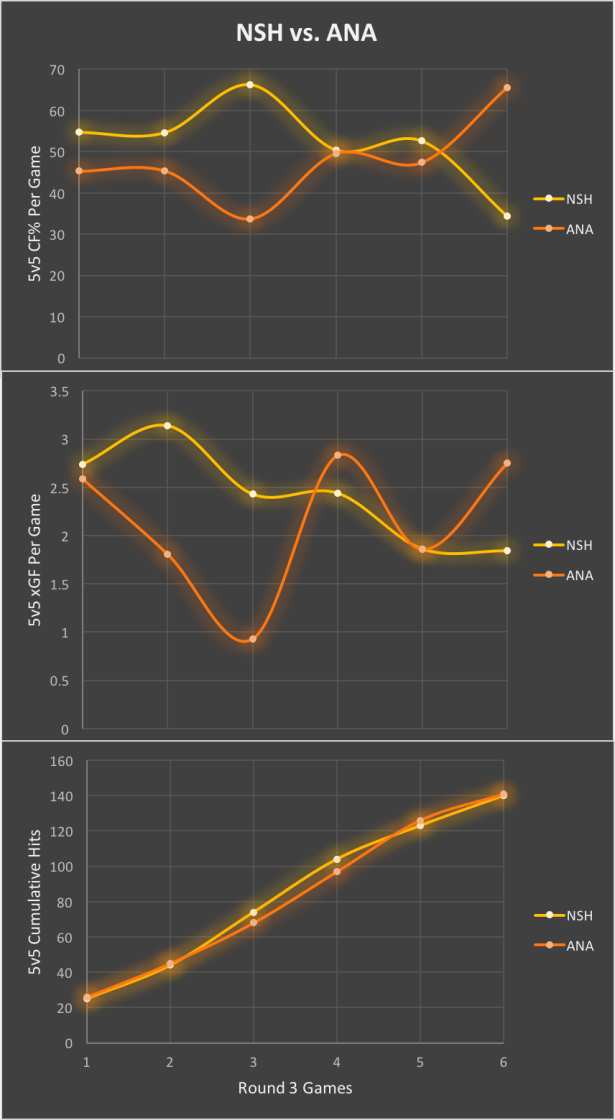
At the other end of the bracket, the Nashville Predators outhit their opponents in the first two rounds of the playoffs, until they met the Anaheim Ducks in the Western Conference Final. They finished this series with their highest playoff CF% (52.19), though it decreased from start to finish. Their xGF per game also dropped as the series progressed, after peaking in Game 2.
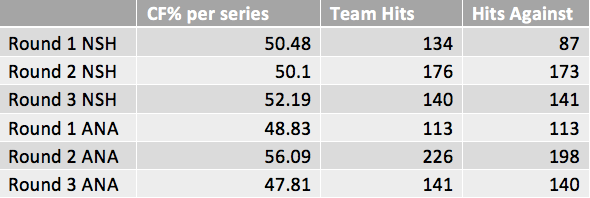
The Ducks CF% and xGF per game increased from start to finish against the Predators, although both dropped in Game 3. More indicative than their hitting was the fact that their CF% was the lowest of the playoffs (and lower than Nashville’s) in this series – and that has a well-studied, proven correlation with losing.
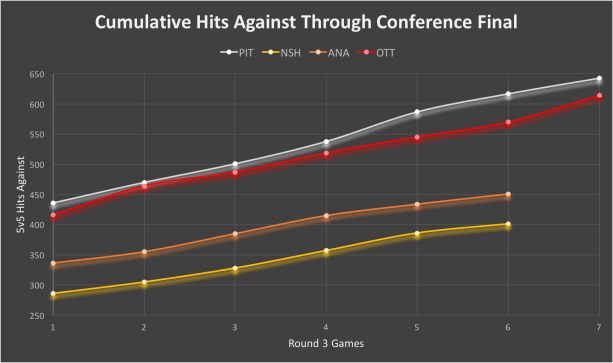
Finally, when we look at the cumulative playoff hits against for all teams, it is clear that the Eastern Conference finalists went through much more wear-and-tear than their Western Conference counterparts. This may shape the outcome of the final series.
*Data is at 5v5, via Corsica.hockey and NaturalStatTrick.

I think a more interesting question than “do hits win games?” is whether or not getting hit affects a player’s play. Over the course of a season, does getting hit more correlate to injuries? In a single game, do players dump the puck or chip it out more than they normally would after being repeatedly hit? Do players take more minor penalties after being hit multiple times or after being hit by certain players? It would be interesting to know if there is any tangible “wearing down” of teams after physical play.