

“85% accuracy, y’all.” Photo by Matthias S., via Wikimedia Commons.
The first round has come and gone, and as we expected before a game had been played, brackets were not going to be fun for everyone. Most people leaning on statistical models saw their brackets chewed up by the vagaries of the playoff sample; SAP, if you’ll remember, hailed their overfit model and its “prediction” of 85% of the past 15 years of playoff series — and proceeded to do no better than a coin flip (they missed all the Eastern teams, and got all the Western matchups). An exception to the #fancystats slaughter was Nicholas Emptage, who went 6-2, which is a good thing if your site is called Puck Prediction. Not even Nicholas was a match for the gut of Steve Simmons, though, who went 8-0 in the first round. It’s the Simmons Hockey League, y’all, and he’s just sliding into our DMs.
But the big question is how our brackets, built on the tried and tested virtues of truculence, size, and experience, fared in this ultimate battle of wits and twits?
| Bracket | Series Guessed Correctly | Team Wins Accuracy |
| Truculence | 3 of 8 | 61% |
| Size | 4 of 8 | 72% |
| Experience | 3 of 8 | 66% |
Immediately after I posted, I realized that there was a lot of overlap in the brackets (which makes sense, if you think about it — truculence/size, sure, and size/experience if you realize veterans are more likely to have “filled out”). Regardless, there was enough nuance to vary our results above. Turns out, our bracket based on “size,” or team body mass index, matched SAP’s predictions, and had a pretty impressive accuracy on guessing the wins for each team. 72% is good, an average 1 game away from a correct guess…though keep in mind, a person could simply guess 6-game series for every team and get 50% in the worst case scenario.
Rather than agonize over the details of the series, let’s just say the teams that won wanted it more than the teams they beat. In the process, size brought our bracket to match a coin flip (as well as SAP, who presumably flips a 24K gold coin), and truculence and experience did not do so well. On to the second round.
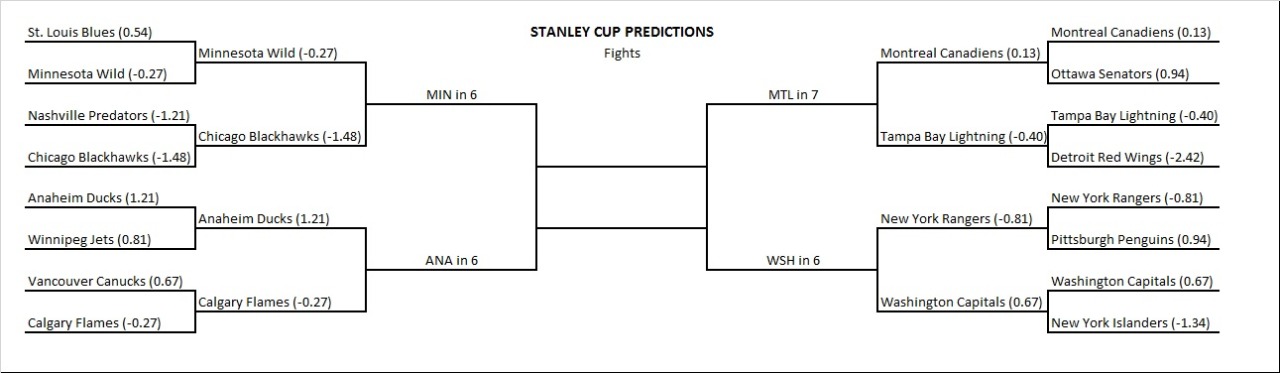
You can click for enlarged images of any one of these brackets. For truculence, Minnesota and Anaheim advance in six games in the West, and Washington in six in the East. Montreal struggles through a seven-game series to close out Tampa Bay.
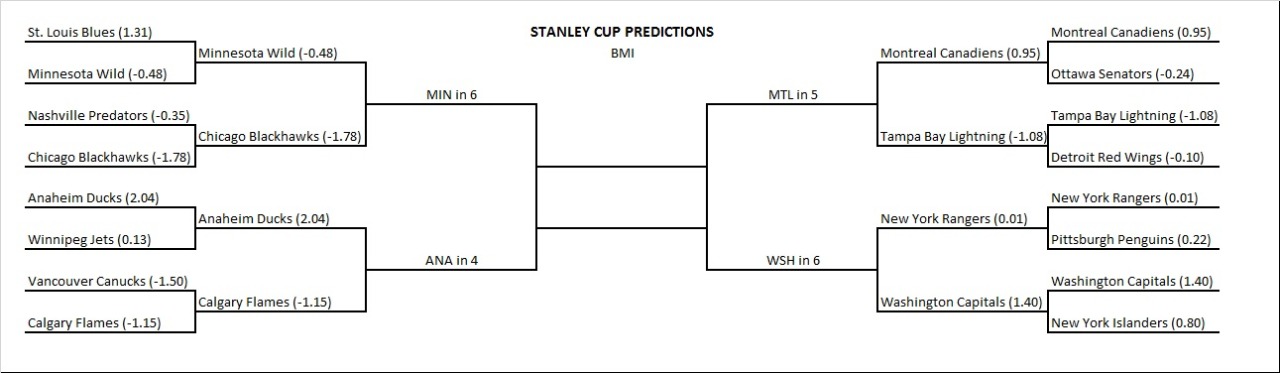
Our “best” performing bracket, size, takes the same winners as the truculence bracket, though with shorter series. Minnesota and Washington still take theirs in six, but Montreal wins in five, and Anaheim pulls a sweep on Calgary.
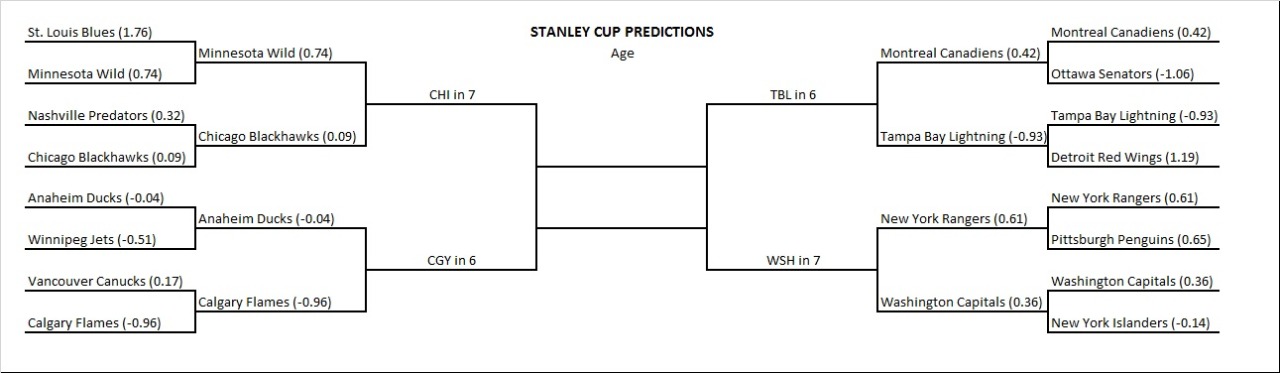
Because I make the rules, and the brackets were too similar, I decided to flip one of the poorer performing brackets. I went with size because a good television pundit could spin and say youth has the energy to play deep into the playoffs. Besides, I should have every right to use my gut in the Simmons Hockey League. Note: Don’t worry, I saved the alternative results (had I held fast to my measures) for the end. Washington and Chicago eke out a seven-game series win, while Tampa Bay and Calgary advance after six games.
Now watch the games, bozos.
