
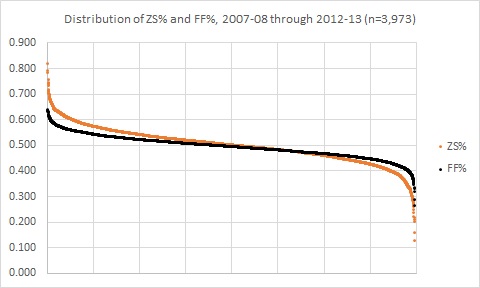
The image above is the distribution of individual offensive zone start percentage (or the percentage of times a player started their shift in the offensive zone) and the distribution of individual Fenwick percentages (shots-for and shots-missed for that player’s team divided by all shots-for and shots-missed, both teams, all tabulated when that player is on the ice). I specifically targeted player season performances wherein the player participated in at least 20 or more games, as that’s roughly around the number of games it takes before these measures start to settle down.
These distributions tell us a few important things for understanding possession, deployment, and how we might analyze the game. Most importantly, after the jump I have a modest proposal, a 60-40 Rule, that might help us in the chase for those elusive, all-encompassing player value metrics.
