

Photo Cred: Eric Hartline-USA TODAY Sports
Due to starting my dive into hockey statistics as a Winnipeg Jets fan, save percentage has always been a pretty big interest of mine, specifically in what it can and can’t tell us. The truth is, it is still a pretty rudimentary statistic and likely will be improved upon in the future. However, simple does not always mean bad or useless.
Of the three most common “goaltender statistics”, save percentage is the one controlled most by goaltenders. How can I be so sure of that? Well it can be provided with simple logic.
A goalie provides the team with wins mostly by reducing their goals against. Everything else is predominately out of their hands. Yes, puck-handling goaltenders can improve the team’s offensive game and possession with assisting in breakouts or they can score the occasional insurance goal – usually on an empty net -, but these are far smaller contributions and also quite rare. Therefore, a goalie best influences win percentage by lowering their goals against average.
But how is goals against average calculated? Well most people would say all the goals against a goaltender allows divided by the number of games they have played (Edit: not exactly, average is per 60 minutes of play to make up for extra time or getting pulled; thanks Pierce for the reminder); however, there is another way. You take the average shots against a goaltender faces per 60 minutes and multiply it by (1-sv%). In other words, goals against average has two components: 1) how many shots a goaltender faces and 2) how many shots a goaltender stops, AKA save percentage. A goaltender has very limited control on the amount of shots they face, but they do have a relatively greater control in how many they stop.
This article is the start of a series where we will be revisiting some old quality posts by hockey analytical types and also making some investigations of our own on goaltenders and save percentage.
Why save percentage?
The fact that good save percentage leads to more wins is only half the battle. After all, both Corsi% and goal% (ie: +/-) leads to wins, but they are not considered equal statistics in determining a player’s or team’s abilities and values. The difference is in how much a player has control over the statistical outcomes. While goal% is the more desired output, Corsi% measures a player’s input better as it is effected less by variance or chance.
How do we determine control? The same way you determine whether your buddy’s trick shot at a game of basketball is legit or not: let’s see you try that again! Repeatability shows amount of control, and it is unfair to evaluate someone by something they do not control the outcomes for.
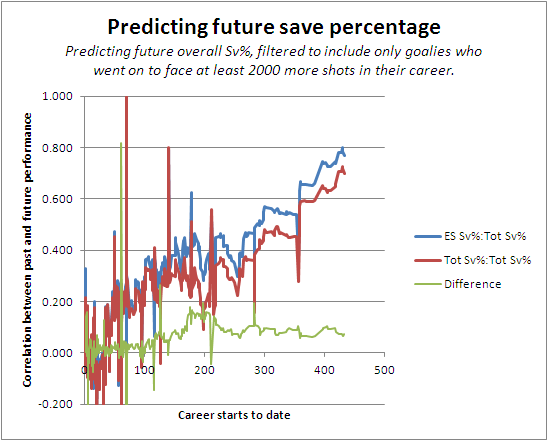
Eric Tulsky has measured save percentages repeatability, or rather ability to predict future save percentage, when he was trying to evaluate whether and where Sv% is better used with even strength or all minutes:
Broad Street Hockey: Judging Goalies: Should We Include PK Save Percentage?
We can see here that save percentage is highly repeatable and predictive, as far as sports statistics go, once sufficient sample size is met.
What problems then does save percentage have?
There are a few, but the largest problem with save percentage is one that is rarely stated by those arguing against: time. While there is less variance in save percentage than other goaltender statistics, there is still quite a bit. So, it takes a large sample to remove the noise and get to a goaltender’s true talent level.
However, in time, a goaltender’s save percentage stabilizes and the larger sample spacing can be used to make probabilistic predictions of future outcomes (more to come later). The larger a sample size, regardless of the statistic be save percentage, Corsi, +/-, goals, or anything else, the less likely the values come by chance.

Arctic Ice Hockey: Fooled by Randomness: Goaltender Save Percentage
Desjardins shows here how the probability of a goaltender’s save percentage being due to chance steeply falls with diminishing returns as shots are added. From this graph we determine that at 1500 shots against you can say with a pretty high confidence level that a 0.925 EVSV% (or lower) goaltender is performing near or at their skill level. This is why most statistical analyst use a minimum of 15k threshold for evaluating goaltenders.
Benjamin Wendorf once used this information to show how Pavelec’s save percentage regressed towards his career numbers similarly.
But, obviously most of you care about this year. We can even see in a small and volatile sampling as this season the 10 goaltenders with the most starts are moving towards regression:

There are also team factors, but we’ll get deeper into this later in the series.
What about the experts you alluded to?
Often those opposed to save percentage (or rather: someone who does not like being told the goaltender they like is relatively not that good) will back up their opinion based on the words of so-called experts. Usually these are members of the media, often former goaltenders themselves. Other times, it is the vote of confidence a General Manager gave in giving his goaltender a rather healthy contract.
Truth is, at both the amateur and professional level, talent evaluation of goaltenders is far behind that of skaters.
We can see here, the difference in efficiency of amateur skater scouting versus goaltender scouting:
Love this graph… From @MattyPfeffer draft tableau, value of goaltenders versus draft position. pic.twitter.com/sQUKAEubhv
— Garret Hohl (@garrethohl) December 12, 2013
To compare, here’s forwards for the same thing: pic.twitter.com/DL97qOl11q
— Garret Hohl (@garrethohl) December 12, 2013
The measurement is the average GVT at a particular draft selection for that position. There is a pattern with diminishing returns as you move from left to right for skaters; however, with goalies we see a rather random pattern.
During the Christmas break, I ran two linear regressions of the 60 goaltenders with the most 5v5 minutes this season. One was looking at how well GMs evaluated goaltender efficiency, by comparing 2014 salary of a goaltender versus their 20113-2014 5v5 save percentage. The other was looking at the power of this rudimentary statistic, using the relationship between a goaltender’s 2010-13 5v5 save percentage versus their 20113-2014 5v5 save percentage.

The salary slope is flat, to 7 decimal places… that’s pretty substantial! Essentially the average high-paid goaltender was about as efficient at stopping the puck as the the average league minimum goaltender. Some may excuse GMs due to the large variance in small sample Sv% – after all, this is only up to late December – but we see there is a positive relationship between past and this season’s save percentage in the second column, and it is 3x stronger. Yes, neither have a “strong relationship”, but this is expected with the small sample and large variance. But, as Eric Tulsky showed above, that relationship is is going to get substantially stronger in R^2 department for the 3 year Sv% as we move to larger sample size this season.
Basically, even though there is a lot of randomness in this season’s goaltender save percentage due to small sample space, stats still predicted goaltenders ability to improve a team’s chance to win with greater accuracy than GMs did.
This is only the shallow end of the pool, but we’ll look into more relationships as this series continues.

Very nice article. However, GAA isn’t calculated by goals against by games played. It’s calculated by dividing goals against by minutes played and then multiplied by 60.
“One was looking at how well GMs evaluated goaltender efficiency, by comparing 2014 salary of a goaltender versus their 20113-2014 5v5 save percentage.”
I’m not sure if you accounted for this, but considering the type of contract is important too. ELCs will generally pay less than deals that cover only RFA years, which will generally pay less than deals that cover RFA and UFA years, which will generally pay less than deals that cover only UFA years.
Without adjusting for that, the correlation isn’t a completely fair way to test the GMs. A GM who is a perfect talent evaluator might take an elite goalie with his first round pick, make him the starting goalie, and get elite goaltending for $900k for three years, and maybe $4M per year for a few years after that before he finally gets the $7M+ that his performance warrants.
There wasn’t any adjustments done… yet.
The post was to mostly introduce ideas and give a very surface view. Part two is a whole dumpload of regression curves that I have accumulated, including an indexed salary.
so there is a fundamental mistake here in how you’ve discussed the strength of relationship between save percentage and previous save percentage/salary. the slope is in fact meaningless to compare two variables to each other, or in any absolute sense to gauge the strength of a variable as a predictor without taking into consideration the scale of the predictor in relationship to the scale of the criterion. in this case, I’ll go out on a limb and guess that salary was entered in dollars and save percentage was entered as a value between 0 and 1, maybe 0 to 100? so the slope that you’re presenting is the change in save percentage (actually proportion if it’s between 0 and 1) for each extra $1 that a goalie is paid. That’s obviously kind of absurd. Better to divide the salary by $1,000,000 before running the model and get the slope associated with each extra million dollars in salary. At least it would be interpretable. Or maybe per $100,000. The same issue kind of arises with the previous year’s save percentage if you’re entering it as a number between 0 and 1 rather than 0 and 100. Since the slope is the change in the criterion for each step up in the predictor, the slope represents the expected difference between a goalie with a save percentage of 0 compared to a goalie with a save percentage of 1. Since that doesn’t actually happen, probably best to perhaps change save percentage to actual percentages (out of 100). If you want to compare salary to previous save percentage, then just use the pearson correlation coefficient which you’ve presented, since it’s simply a standardized version of covariance and the two variables can be directly compared. Or use the R-squared. Based on that, both pretty much suck, but prior save percentage is over three times better than salary.