Using Data to Inform Shorthanded Neutral Zone Decisions

The following is data is all at 4-on-5 with both goalies in their nets. A special thanks to Evolving Hockey for data and their scraper.

In March of 2019, Mike Pfeil coined the term “powerkill” at the Seattle Hockey Analytics Conference. It was much more of a small excerpt from his whole presentation, but it seemed to motivate Meghan Hall and Alison Lukan. In the coming months, Lukan would write about how the Columbus Blue Jackets utilized an aggressive approach in their penalty killing system, while Hall would present at RITSAC and OTTHAC before they finally came together to present at the Columbus Blue Jackets Hockey Analytics Conference in February.

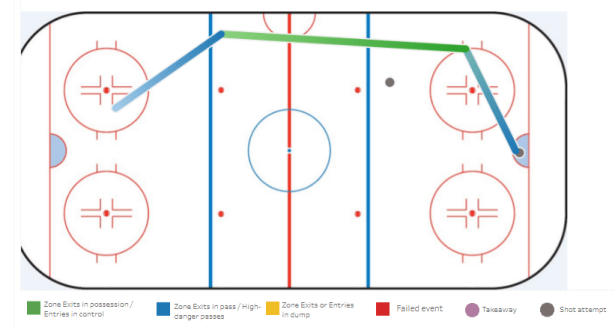
Looking to continue researching this phenomenon, I set out to answer a few questions I had. In order to give shots some added context beyond what the NHL’s public data supplies, throughout the last few months, I tracked shot assists and where possessions leading to shots had started. As a side benefit, I was also able to filter out shots that didn’t appear to exist, were recorded incorrectly, or where the possession started at 4-on-4.

In 2016, Matt Cane developed a metric to approximate penalty kill aggressiveness by combining penalty kill controlled and failed entries for, and dividing them by the entries a penalty kill faces from their opponent. The theory behind that being that penalty kills that attempt to control more entries into the offensive zone are inherently more aggressive. Hall and Lukan also found that a penalty kill’s rate of controlled entries has a strong correlation to the rate at which they take shots.

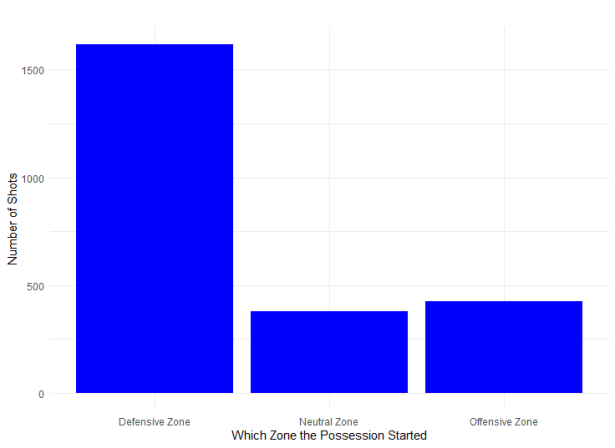
Part of the reason these two stats have such a strong correlation is that the vast majority of shots require a zone entry. Not including rebound shots, 82% of 4v5 shots stemmed from possessions starting outside of the offensive zone over the course of the 2019-20 season.

zones

Continue reading

By the numbers: thinking about the World Championships a different way

This post was co-authored by Shayna Goldman and Alison Lukan

As part of the global response to the COVID-19 pandemic, the 2020 World Championship was cancelled. But, we still wanted to see how rosters for an international tournament with NHLers could have shaken out. While it’s easy to just put together an All Star lineup for most countries, we wanted to add a twist: each country’s roster could only include NHL players and each team had to be compliant with the 2019-20 salary cap. 

So what does this look like? A little bit about our process, first.

Six teams will compete in our fictitious tournament: Canada, USA, Sweden, Finland, Russia, and Europe. Each roster consists of 12 forwards, six defenders, and two goaltenders. Because we were limited to NHL players, talent from outside of those core countries in Europe was combined to form one super team. 

Continue reading

Introducing Offensive Sequences and The Hockey Decision Tree

If you ever work for a hockey team as an analyst, you could be facing two very recurrent questions from the coaching staff. The first one is very practical: How can analytics help us work better and faster? The second one is: What is the real contribution of each player? Meaning beyond the usual on-ice “possession” stats like Corsi or Expected Goals and individual production metrics such as shots taken, scoring chances, expected goals created, zone exits, entries, or even high-danger passes (passes that end or go through the slot). But those events were not yet statistically linked to each other. Finding a way to provide answers to both questions was my goal for the last few months, and the solution was: I needed to split the game in “Sequences”.

Video coaches often break down game tape to highlight certain plays, such as a rush-based attack or a zone exit under pressure. I wanted to do the same and divide a game in as many parts as necessary, or “Sequences”. Roughly, every time the puck changes possession between teams, a new Sequence” begins. That’s about 250 Sequences per game.

Looking at this from the point of view of the team that owns the puck, offensive Sequences extend from the moment a team gets control of the puck and starts moving forward, to the moment she loses it for good, and it must include a shot attempt in the process to have a positive value. How does this work? Let’s say a player gets the puck back in your defensive zone, you try a zone exit but fail. Sequence starts over, there can only be one exit recorded in the Sequence. So he tries another zone exit and succeed, gets into the offensive zone, the team records a couple of shot attempts, loses the puck and if the other teams gets enough control of it to try a zone exit, it means the end of the Sequence.

How does this help? Well, the basic principle is to see the total value of a Sequence. We’re use Expected Goals as our measure of “value”. To do that, we add the Expected Goals of the shot attempts in the Sequence. For example, a Sequence with two shot attempts:

  • A high danger shot: 0.23 Expected Goals
  • A shot from the blue line: 0.01 Expected Goals
  • Total Sequence value: 0.23 + 0.01 = 0.24 Expected Goals

Sequences

Continue reading

Which League is Best?

This work is co-authored with Madeline Gall.

While scouting for some sports is straightforward (college football → NFL), scouting for the NHL can be a more arduous process. With players from over 45+ international ice hockey leagues, each with its own regulations and difficulties, how can one adequately assess the quality of a player’s performance? Comparisons between leagues are not easily made; 18 points for an eighteen year old playing against other eighteen year olds in a minor league should not be attributed the same value as 18 points for an eighteen year old playing against veterans in the NHL. 

There have been other attempts to account for this, including player translation variables, like that of Rob Vollman’s hockey translation factors, and Gabriel Desjardin’s NHL Equivalency Ratings (NHLe). Desjardin’s NHLe previously tackled the issue of comparing and predicting player performance for League-to-NHL transitions (moving from another league into the NHL). It was great for a quick, general comparison and certainly has its advantages (easy and quick to calculate), but there are some drawbacks to its method. For starters, it didn’t necessarily control for team quality, position, and age. Translation factors are calculated using statistics from players who have played at least 20 games in the given league before playing at least 20 in the NHL. That means there’s a lot of valuable data about these in-between transitions that aren’t being used. 

In this project, we introduce a new method for comparing and projecting player performance across leagues using an adjusted z-score metric that would account for these drawbacks. This metric controls for factors such as age, league, season, and position that affect a player’s P/PG metric, and could be applied to any league of interest. This new metric is necessary as there are many characteristics that vary from league to league. Due to the different playing styles and opponent difficulty, there is not one consistent metric to make comparable evaluations of player performance for hockey leagues around the world. Other factors such as goalie strength, penalty rates, and rink dimensions are also inconsistent across international leagues. Scenarios could occur in which players of similar strength could appear to have seemingly different performances.

Continue reading

An Introduction to R With Hockey Data

I have written a couple articles over the past few months on using R with hockey data (see here and here), but both of those articles were focused on intermediate techniques and presumed beginner knowledge of R. In contrast, this article is for the complete beginner. We’ll go through the steps of downloading and setting up R and then, with the use of a sample hockey data set, learn the very basics of R for exploring and visualizing data.

One of the wonderful things about using R is that it’s a flexible, growing language, meaning that there are often many different ways to get to the same, correct result. The examples below are meant to be a gentle introduction to different parts of R, but please know that this really only scratches the surface of what’s available.

The code used for this tutorial (which also includes more detail and more examples) is available on our Github here.

Downloading R and Getting Set Up

Continue reading

Lateral Puck Movement in the NZ

Research shows that lateral/”east-west” puck movement in the offensive zone is beneficial to increasing one’s odds of scoring. But I have now heard from people in various positions within the hockey industry on why it might also be useful to generate east-west puck movement in the neutral zone. The theories – focused on lateral passing, lane changes and stretch passes, respectively – all boiled down to one point: When you rush the puck up ice, the defending team will focus on that side, leaving the other side of the ice somewhat more open, so there might be open ice to exploit.

Continue reading

Passing clusters: A Framework to Evaluate a Team’s Breakout

Quick breakouts – trying to move the puck out of your zone right after gaining possession – make up roughly 38% of possessions and account for 22% of all shots and 22.4% of Expected Goals (at least according to my possession and xG definitions). Therefore, understanding what does and does not work when breaking out the puck against present forecheckers is important. There is evidence that passes from the defensive half boards by wingers inside produce more offense than those straight up ice. But the puck is more often recovered elsewhere, so these passes by wingers aren’t the first pass in a possession and are therefore presumably influenced by the previous play. It should be interesting to find out how the inclusion of the pass(es) that came before affects this conclusion.

Continue reading

A crowdfunding initiative to promote diversity at the Columbus Analytics Conference

I’ve been fortunate enough to be able to attend the last three years of the RIT Sports Analytics Conference. The first year I went, I was nervous to meet people whose work I admired. I was afraid that nobody would want to talk to this new person that few people knew and who was just starting to learn about the field. 

I could not have been more wrong. 

Continue reading

Exploratory Data Analysis Using Tidyverse

This post assumes beginner knowledge of R.

Welcome to the second article in our series on basic data cleaning and data manipulation! In this article, we’re going to use play-by-play data from two NHL games and answer two questions:

  • which power play unit generated the best shot rate in each game?
  • which defenseman played the most 5v5 minutes in each game?

In the process of doing so, we’ll cover several topics of basic data manipulation in the tidyverse, including using functions, creating joins, grouping and summarizing data, and working with string data.

Continue reading