
If you ever work for a hockey team as an analyst, you could be facing two very recurrent questions from the coaching staff. The first one is very practical: How can analytics help us work better and faster? The second one is: What is the real contribution of each player? Meaning beyond the usual on-ice “possession” stats like Corsi or Expected Goals and individual production metrics such as shots taken, scoring chances, expected goals created, zone exits, entries, or even high-danger passes (passes that end or go through the slot). But those events were not yet statistically linked to each other. Finding a way to provide answers to both questions was my goal for the last few months, and the solution was: I needed to split the game in “Sequences”.
Video coaches often break down game tape to highlight certain plays, such as a rush-based attack or a zone exit under pressure. I wanted to do the same and divide a game in as many parts as necessary, or “Sequences”. Roughly, every time the puck changes possession between teams, a new Sequence” begins. That’s about 250 Sequences per game.
Looking at this from the point of view of the team that owns the puck, offensive Sequences extend from the moment a team gets control of the puck and starts moving forward, to the moment she loses it for good, and it must include a shot attempt in the process to have a positive value. How does this work? Let’s say a player gets the puck back in your defensive zone, you try a zone exit but fail. Sequence starts over, there can only be one exit recorded in the Sequence. So he tries another zone exit and succeed, gets into the offensive zone, the team records a couple of shot attempts, loses the puck and if the other teams gets enough control of it to try a zone exit, it means the end of the Sequence.
How does this help? Well, the basic principle is to see the total value of a Sequence. We’re use Expected Goals as our measure of “value”. To do that, we add the Expected Goals of the shot attempts in the Sequence. For example, a Sequence with two shot attempts:
- A high danger shot: 0.23 Expected Goals
- A shot from the blue line: 0.01 Expected Goals
- Total Sequence value: 0.23 + 0.01 = 0.24 Expected Goals
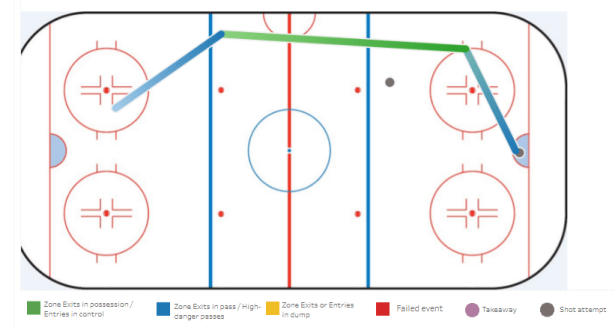
Listing the Sequences would make video analysis easier and allow for any video coach or analyst to focus on Sequences that they deemed important. By tracking the coordinates of all events and rendering Sequences graphically like the example above, it may provide a benefit for anyone working with video/visual analysis, brushing off a game as – patterns can quickly appear under your eyes. This approach also allows for defensive evaluation, listing the most dangerous Sequences from the other team.
What do we include in a Sequence?
Now that we have our total value, let’s look at how we can split a Sequence between its events. First, a Sequence is different from a “shift”, which starts from the moment a player steps onto the ice to the moment they leave it. A Sequence, however, starts the moment a team gets control of the puck and ends when that team loses control of the puck while registering a shot attempt during that period of time. This means there could be multiple Sequences inside one player’s shift. It could also mean a Sequence is not necessarily stopped by a whistle. If the following faceoff is won, the team keeps control of the puck and continues its Sequence, no matter if you are in the neutral or the offensive zone; something led you there and needs to be taken into consideration.
Let’s summarize, A Sequence includes:
- A zone exit: by carrying the puck, a pass or a dump out. It could be successful or failed. As long as the team keeps control of the puck, the Sequence continues. We could imagine a failed pass that results in a puck battle in the neutral zone. If the team wins that battle and enters the offensive zone, the Sequence did not end with the failed pass but started with it.
- A zone entry: controlled (by carrying the puck or a pass) or by dumping the puck in. It could be successful or failed. As long as the team keeps control of the puck, the Sequence continues. Typically, in the case of a failed dump in, as long as the defensive team does not try to exit its zone, the Sequence continues.
- A high-danger pass: a pass that ends inside or goes through the scoring chance area (Homeplate). This does not require that a sot follow immediately. It is not necessary that a shot follows immediately.
- A shot assist: the last pass before each shot is taken, like for primary assists on goals
- A shot: a Sequence includes one or multiple shot attempts, otherwise it would not be considered a Sequence.
The next step in our research is to define how much each type of game event is worth, using expected goals as our value.
Average Expected Goals Creation
Every data was tracked manually in France Ligue Magnus or Switzerland NLA over the last three years by my colleague Mathieu Brosseau and myself. By looking in our database of 11,000 Sequences, we calculated the average Sequence’s Expected Goals value when it included each type of the following events:
- Successful carry exit: 0.064 Expected Goals happen in average
- Failed dump out: 0.076
- Successful zone entry in control: 0.067
- Successful high-danger pass: 0.129
So, a failed dump out creates more value than a successful carry exit? It honestly is a bizarre notion, as it is strange than all types of exits or entries result in something close, around 0.06 Expected Goals. The trick is some events lead to a shot more often than others, and these need to be accounted for.
How Often an Event Leads to a Shot? (“Happening Rates”)
So After defining the average Sequence’s Expected Goals value, the second part of the equation is to look at how often each event leads to a shot attempt, and there we can see logical differences:
- A successful carry exit leads to a shot attempt 37% of the time
- A failed dump out: 4%…
- A successful zone entry in control: 60%
- A high-danger pass: 87%!

Step three is then to put together the average Expected Goals creation and the chance of it happening.
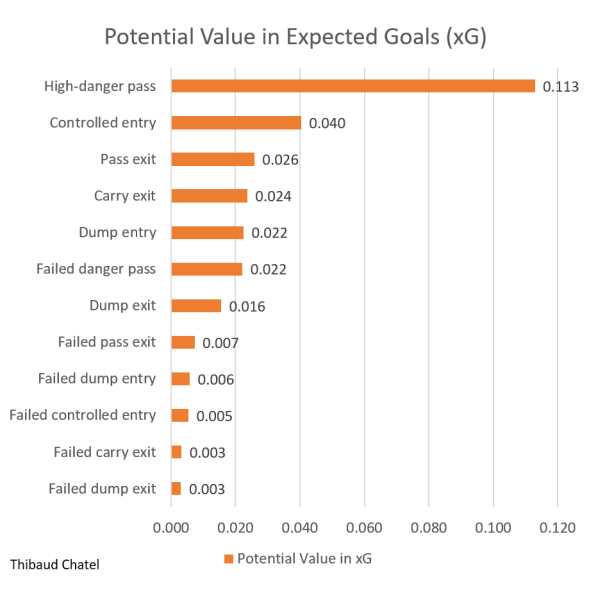
Potential Value of Each Game Event
So, our successful carry exit means there is a 37% chance of bringing an average 0.064 Expected Goals to the team. We could then define it as:
- 37% x 0.064 = 0.024 Expected Goals
- Our failed dump out: 4% x 0.076 = 0.003 Expected Goals
- The controlled entry: 60% x 0.067 = 0.040 Expected Goals
- The danger pass: 87% x 0.13 = 0.112 Expected Goals
In the end, the successful carry exit is worth 8 times more than a failed dump out, and a dangerous pass is worth over 4 times more than a successful carry exit.
Here’s the potential value in Expected Goals of all events included in a Sequence.
The Hockey Decision Tree
So, what’s the point? Previous research have showed the difference between a controlled entry and a dump-in is about two for one. Corey Sznajder data presented at RITSAC 2018 gave 0.66 shots per carry-in, 0.29 shots per dump-in. In our database of 45,000 zone entries, 49% of carry attempts have led to a shot, versus 21% of dumps-in (excluding dump and change). But now we have data to prove how much more dangerous it is. Evidence like this is what coaches can more easily understand and take seriously and all coaches I talked to this year have been very receptive to this.
To sum it all up, I have designed what I called the “Hockey decision tree”, placing all potential value of events, so you can visualize the impact of choosing your next move on the road to the opposing net.

Let’s say you choose to exit your zone in possession, the potential value of your offensive Sequence is 0.021 Expected Goals. Should you succeed, it goes slightly up to 0.024 Expected Goals. If you failed, it’s down to 0.003… But you made it to the neutral zone. If you attempt to enter the offensive zone in control, your potential rises again to 0.033. If you dump-in, well, it is down to 0.011. But you made the entry in control, so it’s 0.040 now. Want to try a high-danger pass? It could lead to a potential 0.113 Expected Goals, which is more than a scoring chance, or move the needle down to 0.022. Risk and reward…
You got the idea. This illustrates the impact of every decision a player makes from one net to the other. I can say that professional coaches that saw it said it made them pause, think, and ask a lot of questions. Like what is the potential Expected Goals against you if your zone entry in control fails and creates a turnover? Compared to your own potential offensive value? I’m working on that.
Conclusion
In the end, being able to link events between them seems very helpful indeed. My colleague Mathieu Brosseau and I have been using Sequences with professional teams this season and all coaches have been very happy with the whole concept as well as the visualization of those Sequences in an interactive way. Being able to filter Sequences by game, period, players involved, events included, and total value in Expected Goals provides a good framework to backup video analysis. In addition, a few developments come to mind:
- The research is very rough, of course. More events can be added. Faceoffs? Takeaways in the offensive zone for sure. Hockey Graph very own Daniel Weinberger rightly pointed out to me that exits and entries would have different values if made on the wings or through center ice. Daniel’s work on passing clusters published this year also points at the value of analysing statistically and visually what happens ahead of the offensive zone. Soccer has been ahead of hockey as well in this matter, also trying to figure out what’s probable to happen next after every move.
- Secondly, the natural follow-up was the creation of an Expected goals Contribution (xG C) metric for players, dividing the value of a Sequence between the players involved based on how they participated. More on that later!
[⚽️📈] Which channels do teams exploit during buildup play? Using historical passing and dribbling data, we can simulate the movement of the ball to surface team-specific tendencies!
(this uses the Markov transition matrix described in my post on xT: https://t.co/FA0Y1AuERw) pic.twitter.com/NMkb9uiuAl
— Karun Singh (@karun1710) February 20, 2019

Really an interesting text.
Shows that zone exits (at least at first sight) seem to contribute very poorly to offensive success. This would mean that getting the puck out is the main purpose…
Manual tracking is quite a challenge but gives us a clear overview of offensive contribution for each action that lead to a sequence. Just one question: would it be relevant to include the type of entry (ex. transition entries (3v2, 2v1, etc.) and clear path (shot location) as additional determinants for expected goal ?
Thanks!
If you mean that carry or pass exits are worth close to half a carry entry in xG, than yes. It is just that so much still has to happen between the exit and a shot.
Yes, type of entry, side or center ice would be natural additions, my xG model also will be reviewed this summer, but manual tracking imposes limitations I can’t overcome… such as a game needs to be done in one evening 🙂
But I imagine the concept could be easy to apply once we get tracking data from the NHL.
Great article, thank you for the hard work and sharing.
THanks a lot !