
This post assumes beginner knowledge of R.
Welcome to the second article in our series on basic data cleaning and data manipulation! In this article, we’re going to use play-by-play data from two NHL games and answer two questions:
- which power play unit generated the best shot rate in each game?
- which defenseman played the most 5v5 minutes in each game?
In the process of doing so, we’ll cover several topics of basic data manipulation in the tidyverse, including using functions, creating joins, grouping and summarizing data, and working with string data.
The files and code are available on the Hockey-Graphs GitHub page.
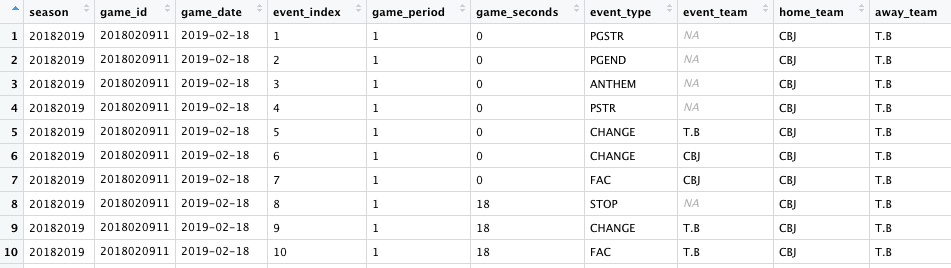
The two games we’ll use for these exercises are the same we used in the previous article: Tampa Bay at Columbus and Vegas at Colorado from February 18, 2019. (These were scraped using Josh and Luke Younggren’s scraper.) Shown below are the first 10 events from that data set.
Which power play unit generated the best shot rate in each game?
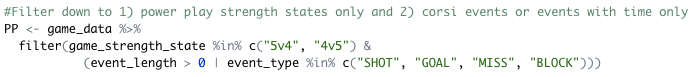
Our first step will be to filter down our data. We’re only interested in power play strength states (5v4 and 4v5 will capture when the home team and the away team, respectively, are on the power play), and we only want events that either have game time associated with them or are shot attempt events. That will eliminate a lot of the extraneous events that we don’t need. (I’ve never understood why there is an event for the anthem.)
For each event, the NHL records which players are on the ice for the home team and the away team. We’ll create a new set of variables that will show who’s on the ice for the power play team, whether it’s the home or the away team.
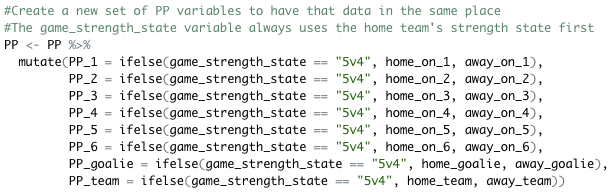
If we want to group data by the power play unit, then we need to have a variable that defines the unit. The unite function will concatenate some of the on ice variables we created previously, and we’ll separate them with a hyphen. (The remove argument indicates that we don’t want to drop those variables from our data set.)
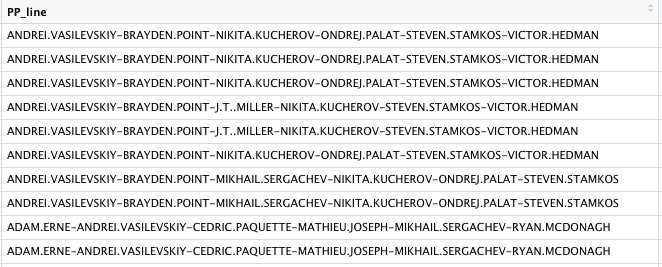
However, we aren’t interested in having the goalie as part of our power play unit. We need to remove that player from the unit, and then we need to deal with the resultant punctuation issue in our line: if we remove the goalie, there will probably be some extra hyphens hanging around. If this is a process that you’ll want to do frequently (which we’ll pretend that it is for this exercise), we can create a function to handle all of these tasks.
This function, named create_line, will look for our specified goalie in our specified line and remove it. It will also morph any double hyphens into a single hyphen and remove any dangling hyphens at the beginning or at the end of our power play line. The str_replace function in the stringr package (which is part of the tidyverse) is very useful for tasks like this.
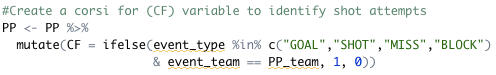
We also want to create a variable to indicate any shot attempt events for our power play team.
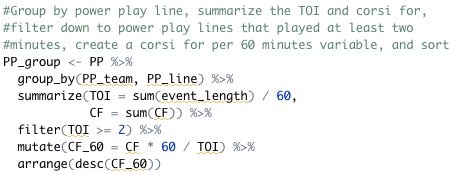
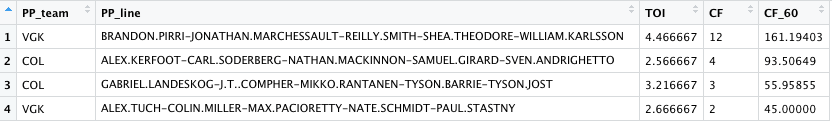
Lastly, we can group, summarize, filter, and sort our data in one chunk of code. This will group by power play unit, sum up the time on ice as well as the shot attempts, filter to units that played at least two minutes, and create (and sort by) the shot attempt rate.
Which defenseman played the most 5v5 minutes in each game?
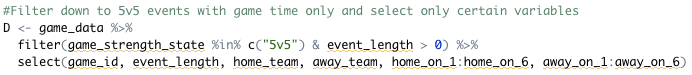
For our defensemen question, we’re also going to start by filtering down our data: we only want events that were at 5v5 and that had game time associated with them, since we’re ultimately interested in ice time. We’ll also use the select function to remove some variables from our data set.
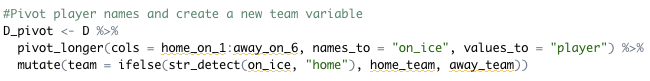
As we saw before, NHL data is recorded by event, and each event lists each player who was on the ice at that time. But if we want player-level data, we need one row per player, not one row per event. Thankfully, we can do this easily with the pivot_longer function. The arguments to this function describe which columns we want to pivot (all of the on ice variables) and what we want the new column of interest to be called (player). We’ll also create a new team variable.
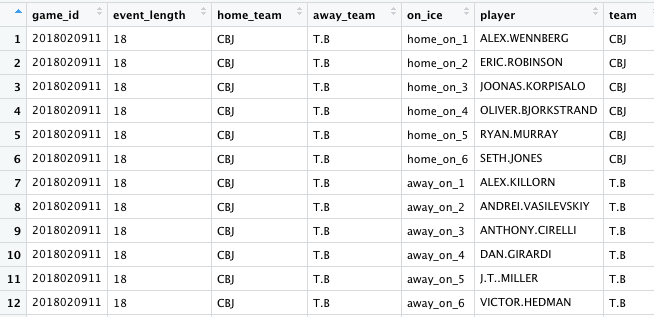
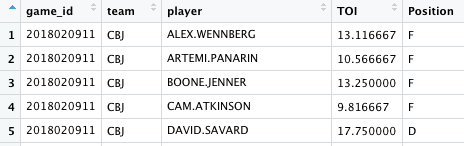
This is how the data looks after pivoting. We still have data by event, each event is now just repeated 12 times for each player that’s on the ice.
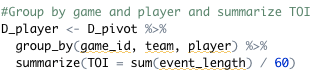
We can group our data by player and game and then summarize to get a total time on ice for each player.
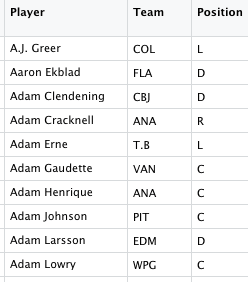
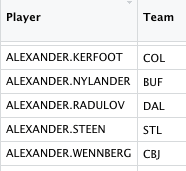
But if our question specifically pertains to defensemen, how do we know which of these play that position? Positional designations aren’t included in NHL event data, so we’ll have to turn to another data source. Natural Stat Trick (naturalstattrick.com) helpfully provides demographic data, so we’ll use a file downloaded from that site.
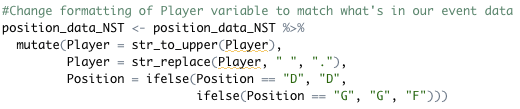
The first obvious difference is that the player names are formatted differently: our original data source uses all capital letters with a period as a separation character, while the NST data source uses title case with a space. We can use str_replace again, as well as str_to_upper, another function from the stringr package, to address this problem. We’ll also recode our position variable, as the original differentiates between and combines different wing positions.
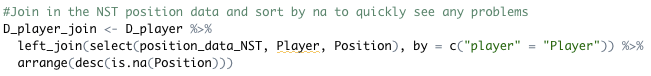
We can now join this positional data into our original player data. We’ll add a line to sort our joined data by NA values, so we can see immediately if there was any kind of problem with our join.
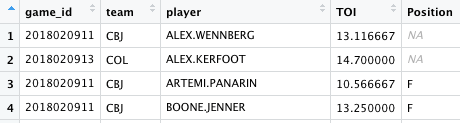
Once you start working with hockey data, this problem will become familiar to you! There are variations in names across data sources. We’ll make the necessary edits to the NST data, with the code shown below, and try the join again.
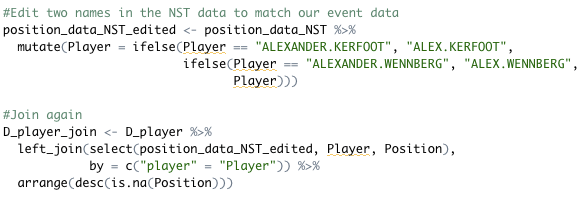
Looks good this time.
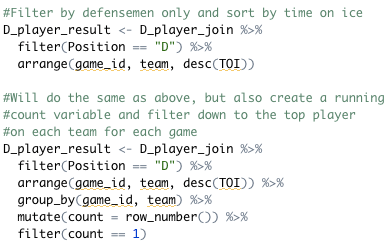
Now we can filter down to defensemen only and sort by game, team, and TOI. We could stop here, or we could take one more step to filter down to only the top defensemen that we want. We can use the row_number function to create a running count by game and by team and then filter down to the top defenseman for each team and each game.


Really good article, plan to go through it in some detail. One suggestion: put a link to the first article up top, so we don’t have to search the site for it.