
There are few questions in hockey analytics more fundamental than who played well. Consequently, a large portion of hockey analysis has been focused on how to best measure results. This work is some of the most well-known work in “fancy stats”; when evaluating players and teams, many people who used to look at goals scored moved to focusing on Corsi and then expected goals (xG).
The concept of an xG model is simple: look at the results of past shots to predict whether or not a particular shot will become a goal. Then credit the player who took the shot with that “expected” likelihood of scoring on that shot, regardless of whether or not it went in. Several such models have been developed, including by Emmanuel Perry, Evolving Wild, Moneypuck, and many others.
However, there remains additional room for improving these models. They do impressive work based on the available play-by-play (pbp) data, but that only captures so much. There are big gaps in information, and we know that filling them would make us better at predicting goals.
Perhaps the biggest gap is pre-shot movement. We know that passes before a shot affect the quality of the scoring chance, but the pbp data does not include them. Thankfully, Corey Sznajder’s data does. While it does not cover every single shot over multiple seasons, it is a substantial dataset; when I pulled the data for this model, it had roughly half of the 2016-2017 and 2017-2018 seasons included: 72 thousand shots from 1,085 games. While the number of games tracked varies by team, we have at least 43 for every team except Vegas, for which we have 26. We can use this data to build the first public xG model that incorporates passes.
There is also past work that indicates that passing information will improve productivity. Ryan Stimson has done an enormous amount of work tracking and analyzing tactical play, with a particular focus on passes. He built a similar model with passing information and found that it was better at predicting a player’s future point production than past points and better at predicting a team or player’s on-ice point production than past point or shot rates.
Besides revisiting that work with a larger and more recent sample size, I hope that my model adds a couple of things. First, I’ve combined the information for pass tracking along with the traditional play-by-play inputs used in past xG models. This will hopefully give us a full picture of what can be predicted using all publicly available features combined. For example, perhaps many players pass but only some are particularly good at passing to shooters in particularly dangerous locations. Combining the pass with the shot location will allow us to give a high value to these shots and credit their participants accordingly.
In addition, I wanted to get a thorough comparison between this model and public xG models using multiple evaluation metrics to get a fuller sense of how much improvement we get from passing data. This will only become more crucial as tracking data becomes available: an initial sense of the gains from passing data will help prioritize additional work to develop more complex models with new data. Finally, building the model allows me to explore additional details in future posts, such as deep dives into team playing styles and investigations into the impact of particular variables.
In this post, I’ll introduce my model and show that it represents a meaningful but not enormous gain over currently available models. I’ll also show some initial insights into what variables are most important for the model; traditional pbp information is most important, but dangerous passes before the shots can dramatically increase the chance that a shot becomes a goal.
The Model
To start, I took the standard pbp data for every unblocked shot and extracted features that are typically included in xG models:
- For every shot, its type, location, distance from the net, and angle from the net
- For the event prior to every shot, the type of event and its location
- The time, distance, and angle change between the shot and its prior event
- Whether the shooter is on the home or away team and the score state
Next, I added info that Sznajder recorded about each shot and the passes that led up to it:
- How many passes (up to three) occurred before the shot, and how many of those passes were in the offensive zone
- Flags to indicate whether the shot was a scoring chance (i.e. from the “home plate” area), results from an oddman rush, and whether or not the goalie was screened
- For each preceding pass, its zone and lane, plus whether it was a royal road, behind the net, low-to-high, or stretch pass
These features are based on what is tracked in Sznajder’s data, which in turn is heavily influenced by Stimson’s Passing Project. We know that the number of passes before a shot influences the shooting percentage, as do the number of offensive zone passes. His project also defined a lot of the qualitative types of passes tracked and indicated that they would be valuable features.
Obviously, this is still a limited amount of data. Perhaps the biggest gaps are the timing and location of the passes, which more detailed tracking data would presumably have. We know from past work by Stimson that the angle change cause by a pass before a shot influences shooting percentage in NCAA games, and I would expect that it does the same at the NHL level.
I also did not exhaust myself with feature design; there are probably clever ways to extract more value from the existing data, like measuring whether the pass’ lane was the opposite side from the shot location. Regardless, this dataset is clearly more developed than any prior one used in a public xG model.
With this data, I compared four different models:
- A basic play-by-play model that ignored all of the new tracking features. This could serve as a baseline of comparison.
- The model created by Manny Perry for his site Corsica.hockey. Again, this is meant as a baseline, though one that comes from more advanced work to maximize model accuracy than I am capable of.
- A pre-shot model that adds the new passing information to the traditional data. This is the model we are most interested in.
- A “Perry Plus” model that takes Perry’s xG model as a feature alongside all of the passing features.
All of these were gradient boosted models, which I chose because they provide good results with minimal work to prepare the data. Again, a more laborious effort to address collinearity and missing values could likely improve the model. I did some hyperparameter tuning but not an enormous amount. In short, I wanted to focus on the gains we would get from the new info, not from me refining the model’s details.
The Results
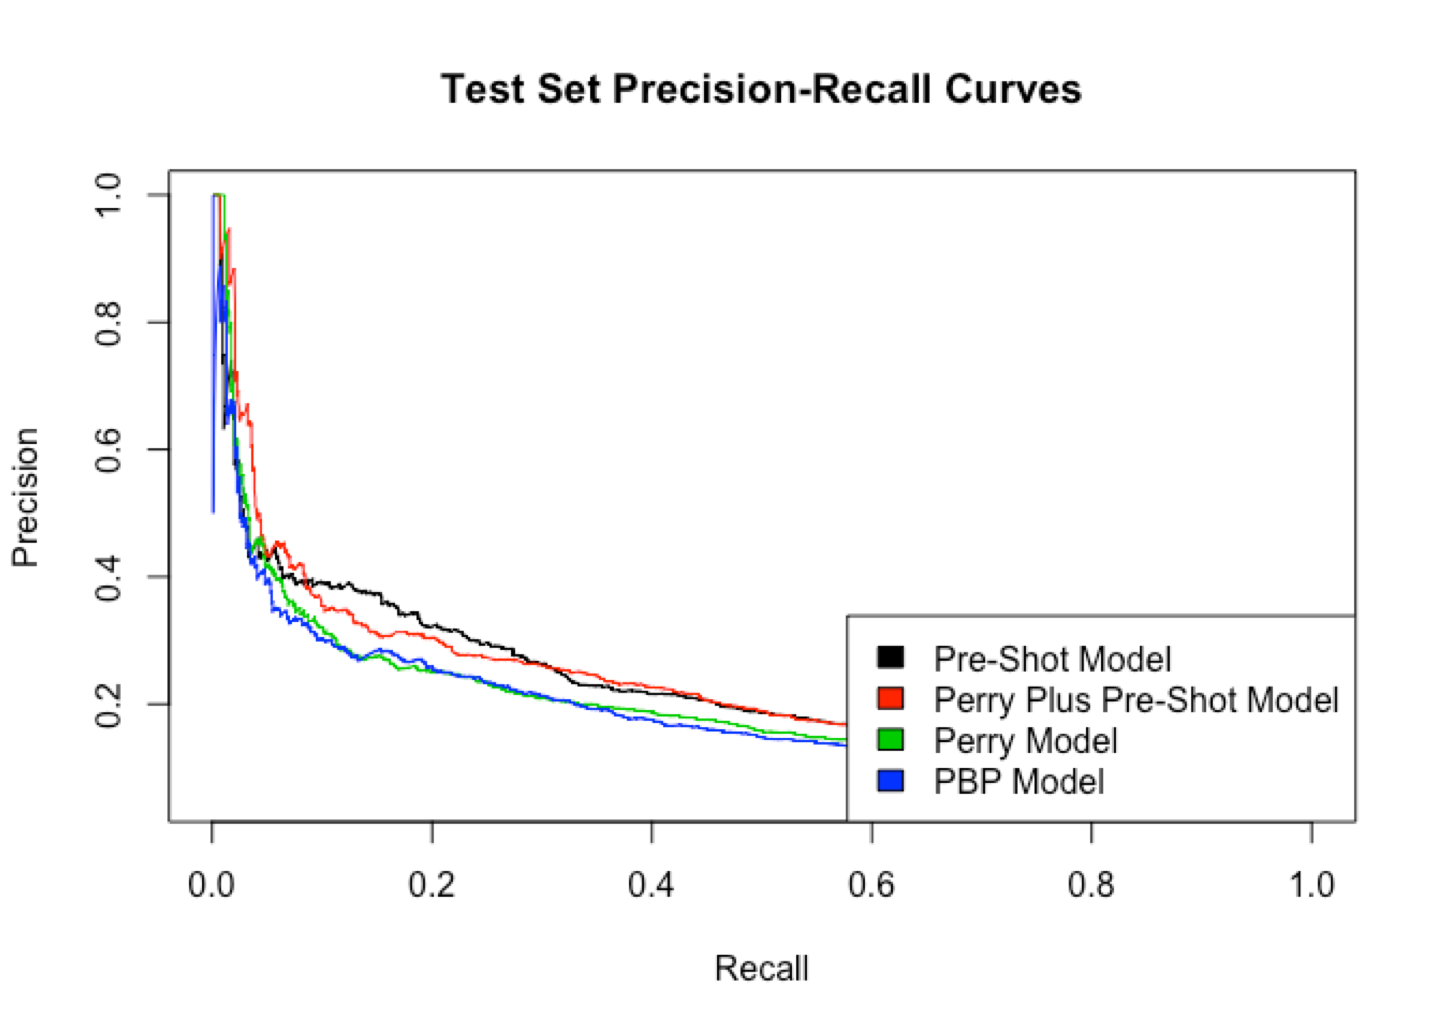
That’s enough words for a website called Hockey Graphs. What do the results look like in pictures? I trained the model on 70% of the data and tested it on the remaining 30%. I also created a “naive baseline” in which I gave every shot an expected value of 5.5%, since that is the average shooting percentage in this test set. Here’s how they scored:

If you’re unfamiliar with ROC curves, the further the curve is to the top-left corner the better it performed. Here, you can see that the black and red lines (the two models with pre-shot movement) do better than the two models without it. The precision-recall chart shows similar results, as do the area under the curve (AUC) and log-loss, though there’s some fuzziness around the latter
| Model | AUC (higher = better) | Log Loss (lower = better) |
| Pre-Shot | 0.797 | 0.178 |
| Perry + Pre-Shot | 0.790 | 0.184 |
| Perry | 0.770 | 0.183 |
| PBP | 0.774 | 0.182 |
| Naive Baseline | 0.500 | 0.213 |
Don’t worry if you’re not familiar with these metrics; the key takeaway is that models do a better job of predicting goals when they have access to pre-shot movement. Consequently, I believe that for games in which we have the data, the pre-shot model is more accurate than existing public models.
That said, you can see from the charts above that the difference is not enormous. The public xG models do a really great job with the data they have. So while we can expect tracking data to improve predictivity, it will likely be a marginal improvement over the xG models we have now, at the very least until an enormous amount of work has been done on incredibly detailed data on the movement of each player.
Variable Importance
Next, let’s take a look at how the model is making its predictions. All models have a tradeoff between predictivity and interpretability; in general, the models that perform the very best tend to be more difficult to explain. xGBboost, which I used here, generally has higher predictivity and lower interpretability. Detailed understanding of how each variable influences each prediction is possible but requires much more work that I plan to do in a future post. For now, we can take a look at the overall importance of each variable in the pre-shot model:

Unsurprisingly, the traditional features available in play-by-play data remain extremely important; the single most important feature by a wide margin is how close the shot is to the net. Other pbp features like the time since the last event and the angle of the shot also remain very important.
We can then see where the pre-shot data becomes useful. The model gets valuable information from the flag that indicates whether the shot comes from the scoring chance area, whether the shot was screened, and whether it involved an oddman rush. Based on this, if I worked for an NHL team, I would have an analyst look much more deeply into understanding screens and oddman rush plays to see what they are doing and which players or teams are able to create them. The oddman rush variable also includes how many men are involved in the rush on each side, which may be more valuable than a binary “yes or no” flag that’s traditionally used for rush information.
Information about the specific preceding passes is also useful, though to a lesser degree. The first pass-specific variable is whether the pass immediately preceding the shot went across the “royal road” area. This makes sense and further validates that these types of shots are particularly dangerous scoring chances. The model also uses other variables around the location and type of the passes.
That said, this information is directional but should not be taken as gospel. For one thing, many of the variables are correlated with one another, so it is difficult to parse out exactly how important each one is compared to another. For example, the number of offensive passes is not a particularly useful variable, but the model is also looking at how many total passes there are. Much of the same information is included in both variables, so the former would be much more valuable on its own if we did not also have the latter. Keep this in mind as you look at results like the low importance for whether the preceding pass comes from behind the net. Shots with that type of pass are pretty likely to be close to the net and from a scoring chance area, so this correlation may reduce its importance while the pass type itself is still quite important.
Examples
Finally, let’s take a look at some video examples to get a better sense of what the models are seeing (thank you to Shayna Goldman for help pulling the clips). Since each model makes predictions about every shot, we can look at where they disagree to see how they are using different information. For example, the following video shows a shot where the pre-shot model thinks there is 51% chance of a goal, while the simpler play-by-play model thinks it only has a 16% chance of going in:
Keep in mind that the average shooting percentage in this dataset is in the single-digits, so both models agree that this is a better than average opportunity. But the pre-shot model has information that can make it much more confident a goal will be scored. It can see that there was an oddman rush, that multiple passes preceded the shot, and that the final pass was across the royal road and forced the goaltender to move across the net. This is exactly the sort of play that we know is extremely dangerous, and the model agrees when it has the relevant data.
Another play shows similar results. Here, the pre-shot model gives a 41% chance of scoring while the pbp model assigns just 6%:
Again, we see a rush across the ice and a dangerous pass that moves the goaltender.
Finally, let’s look at a situation where the simple model did better than the pre-shot model. Here, the pre-shot model predicts 38% while the pbp model is astoundingly confident at 66%
Both models agree this is a great scoring chance, but the pbp model is able to say so with more confidence. I do not have a great explanation for this, but I suspect it has to do with which shot types each model considers to be the most dangerous scoring chances. The simple model’s most dangerous chances are when there is a quick rebound from a new angle close to the net, so it assigns a very high probability to these types of shots. In contrast, the pre-shot model can also see high scoring chances like royal-road passes. Consequently, it may not be quite as “focused” on goals from quick rebounds, though it does still identify them as strong scoring chances.
And as always, an enormous thank you to Corey Sznajder, whose work makes all of this possible. In my next post, I’ll take a look at what this model can tell us about the performance of specific teams, skaters, and even goalies.
Part 2: Historic Results and WSH Deep Dive
Part 3: 2018-2019 Results and BOS/S.J Style Comparison
Part 4: Feature Interpretation

curious, where is angle of shot data generated from? thanks
Hi Ryan! The NHL releases play-by-play data which includes the x/y coordinates of the shot. Since we also have the x/y coordinates of the net, we can break out trigonometry to find the angle. The Evolving Wild twins have an example of this in their scraper function, which is publicly available on Github: https://github.com/evolvingwild/evolving-hockey/blob/master/EH_scrape_functions.R#L4169