Chatter Charts – Visualizing Real-Time Fan Reactions

Today, I’ll explain the methodology behind Chatter Charts and show you how I use statistics, R and Python to analyze hockey from a completely unexplored angle: your point of view.

I. Introducing Chatter Charts

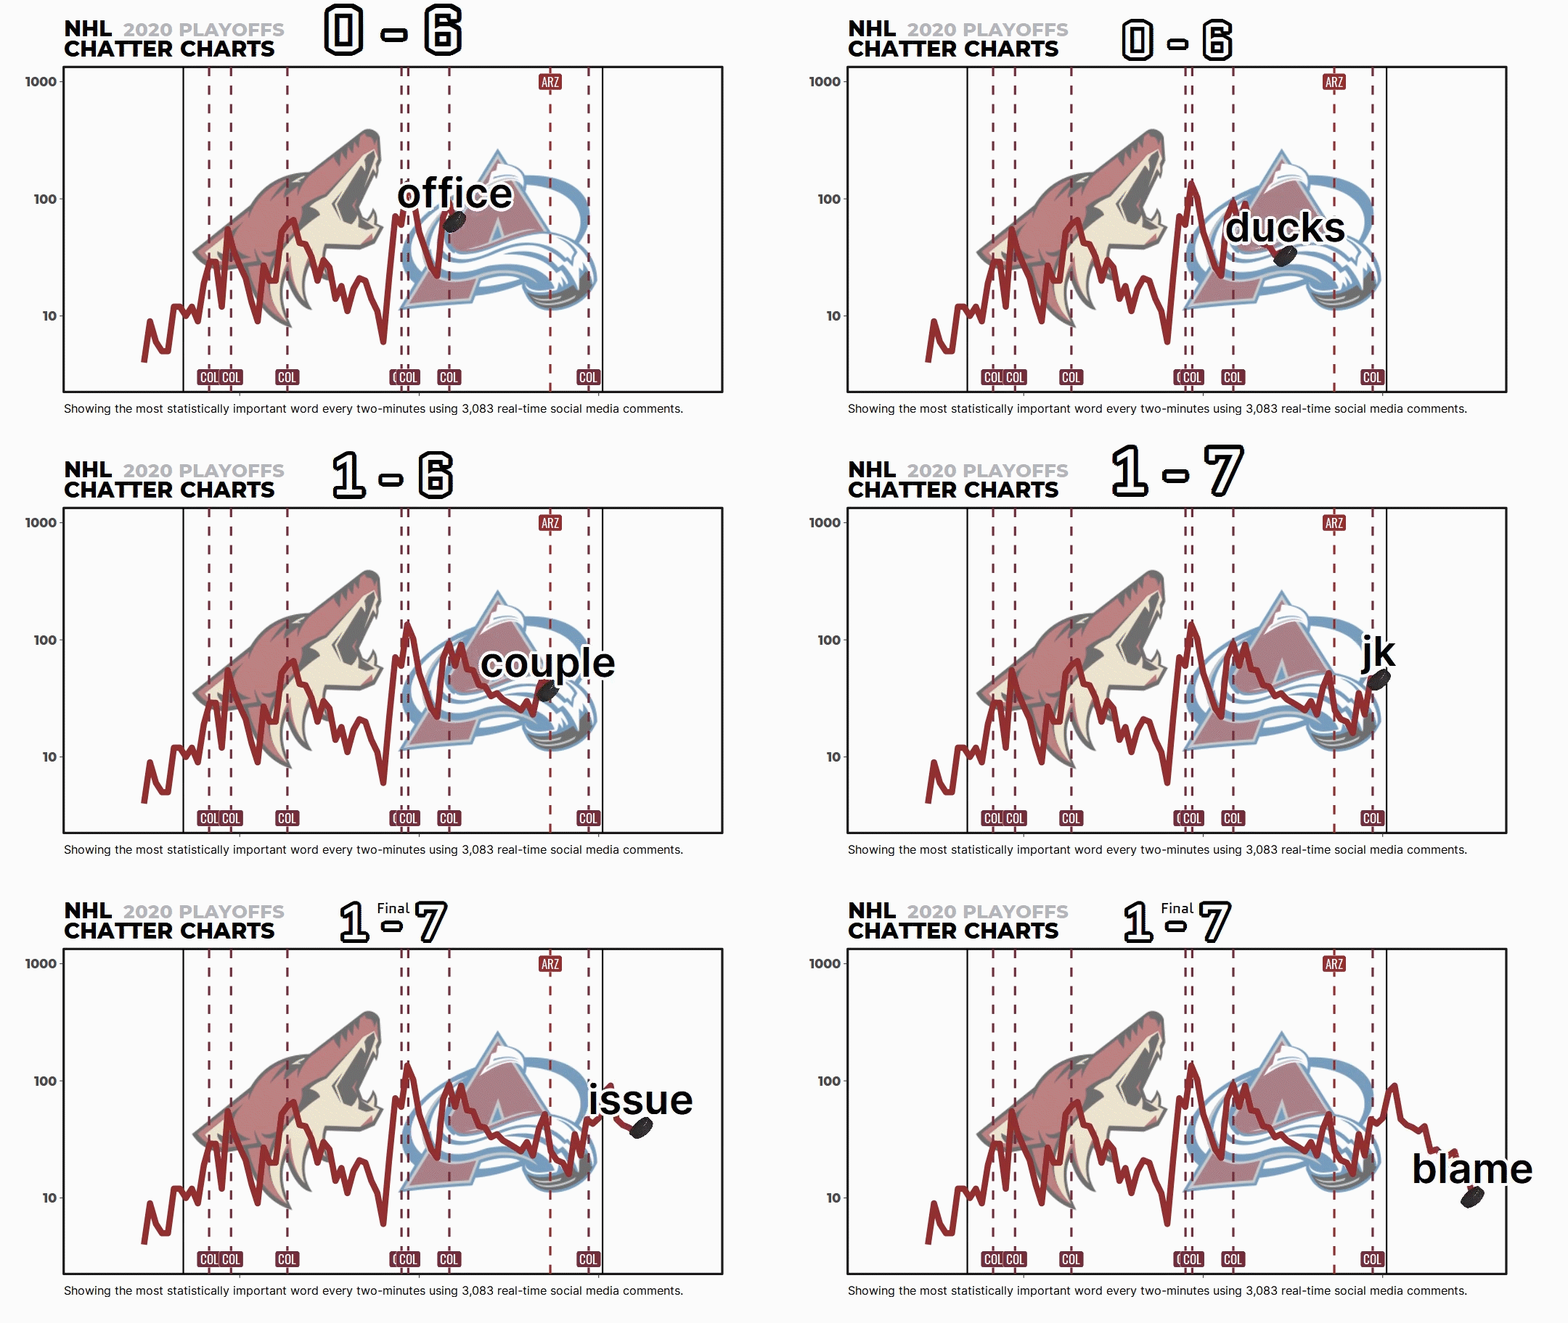
Chatter Charts is a sports visualization that mixes statistics with social media data. And unlike most charts, it is specifically designed to thrive on social media; it is presented in video and filled with volatility, humour, and relatable moments.

It assumes a game is like a linear story—filled with peaks and troughs—except every story is written by fan comments on social media. It actually tries to recreate the emotional roller coaster fans tend to experience when watching sports.

Image for post

But most people don’t know about the math and code behind Chatter Charts. It isn’t just me picking words I think are funny or a simple word count—it uses a topic modeling technique called TF-IDF to statistically rank them.

I want to go through that with you today.

Continue reading

Applied Prospect PipeLinE (APPLE): Assisting the analysis of hockey prospects using Recurrent Neural Networks

The NHL Draft acts as the proverbial reset of the NHL calendar. Teams re-evaluate the direction of their organizations, make roster decisions, and welcome a new crop of drafted prospect into the fold. Irrespective of pick position, each team’s goal is to select players most likely to play in the NHL and to sustain success. Most players arrive to the NHL in their early 20s, which leaves teams having to interpolate what a player will be 4-5 years out. This project attempts to address this difficult task of non-linear player projections. The goal is to build a model for NHL success/value using a player’s development — specifically using all current/historical scoring data to estimate the performance of a player in subsequent seasons and the possible leagues the player is expected to be in.

Continue reading

Racial Bias in Drafting and Development: The NHL’s Black Quarterback Problem

Introduction

It is far from shocking that the National Hockey League has no peer among major American sports leagues in terms of racial homogeneity. Most estimates place the proportion of White players in the league in the range of 92-95%, far from comparable leagues like the National Football League, National Basketball Association and even Major League Baseball.

In the past year, the league celebrated an obscure but rather dubious milestone. If you combined all the faceoffs* taken by every Black player** in the NHL between 2008 and 2019, you would end up with 14,375 total faceoffs, or about 20 fewer than Golden Knights center Paul Stastny in that time frame (according to Hockey-reference.com). It was only in this past season that the total of the Black players overtook Stastny.

A close up of a map

Description automatically generated

Continue reading

Examining Player Development in NCAA DI Women’s Hockey with Game Score Pt. 2

Continued from Pt. 1

When do women’s hockey players reach their peak? How do they develop? These questions may sound straightforward, but they are exceedingly difficult to answer because of the finite opportunities for players to pursue high-level post-collegiate hockey. There is no consensus “top” professional league in the world, and major international tournaments are brief; conclusions we draw from them can be heavily skewed by the group format.

For all these reasons and more, NCAA DI (Division I) is a logical place to explore player development. It is data-rich, relative to the rest of women’s hockey, and Carleen Markey’s work with aging curves placed CWHL (Canadian Women’s Hockey League) skaters’ peak offensive production between the ages of 22 and 23. That falls within the range of many collegiate careers.

Credit: Carleen Markey

The Pipeline

The zenith of skill and competition in the world of women’s hockey are the Olympics and the IIHF Women’s World Championship. These tournaments are filled with, and often dominated by, active DI players and alumnae. As one might expect, the majority of those players represent Team USA and Team Canada.

At the 2019 Worlds in Espoo, Finland, all of Team USA’s roster and 20 of the 23 players on Team Canada spent at least one year in an NCAA DI program, compared to just five of the 23 players on Team Finland’s silver medal-winning team, and one player on Team Russia’s fourth-place team. 

That said, there are more international players playing college hockey in North America every year. Per biographical data on EliteProspects.com, the ratio of international players in DI hockey climbed from 4.17 percent in 2015-16 to 5.07 percent in 2019-20.

Those percentages don’t mean much without the context of the women’s hockey landscape across the globe. According to the IIHF, there are 88,732 registered female players in Canada and 82,808 in the U.S. Outside of North America, there are 26,381 registered players in Sweden, Finland, Czech Republic, Russia, France, Germany, Switzerland, Japan, and Norway combined.

Continue reading

Examining Player Development in NCAA DI Women’s Hockey with Game Score Pt. 1

Carleen Markey broke new ground with her presentation on women’s hockey aging curves in the CWHL (Canadian Women’s Hockey League) at RITSAC 2019. Her work, which was built from the scaffolding of the Evolving Wild twins’ aging curves, established that offensive production among CWHL skaters peaked around age 22 to 23. That work by Markey got me thinking about how players developed just before going pro in North America and Europe, and/or becoming fixtures on national teams.

So, I set my eyes on NCAA DI (Division I) women’s hockey.

DI schools have served as the primary pipeline of talent for Team Canada and Team USA for decades. Furthermore, DI schools have served as a valuable proving ground for many of the most talented European players in the world. With Carleen’s work in mind, I set out to analyze how skaters developed in DI hockey before they reached their peak production years and their athletic prime.

Approach 

The greatest obstacle to any statistical analysis of the women’s game is the scarcity of public data. Fortunately, NCAA DI is something of an exception because of sites like collegehockeystats.net, collegehockeynews.com, and the database on HockeyEastOnline.com.

I decided on developing a game score for DI hockey to serve as an all-in-one stat that could provide a rough measure of a player’s overall impact or value. Dom Luszczyszyn first applied game score to hockey, and his work provided a framework. Creating game score for DI hockey was also appealing because I was able to apply lessons learned from working with Shawn Ferris’ NWHL (National Women’s Hockey League) game score. At the time, this sounded like fewer headaches for me. I was wrong; I had forgotten how many headaches there were the first go around.

Continue reading

How to Debug Data Science Code

Think of everyone who has a talent you admire. Athletes, writers, anyone. If you were to ask each of them for the secret to their success, how many of them would be able to give the true answer? I’m not saying that they would deliberately lie. Rather, it’s just genuinely very hard to objectively assess oneself and turn natural implicit behaviors into explicit lessons that can be described to others.

Implicit lessons can be a barrier to people learning new skills: it’s much harder to learn something if their instructor doesn’t know it’s something they ought to teach. The best teachers are able to put themselves into the shoes of their students and convey the most important pieces of information.

One area of data science that is too often left implicit is troubleshooting. Everyone who writes code will get error messages. This is frustrating and can halt progress until solved. Yet most resources devoted to teaching new data scientists don’t discuss what to do, as if they’re expected to study enough to code everything correctly the first time and never encounter an unexpected error. You can find articles about common mistakes that data scientists make, but what about when you inevitably make an uncommon one? There are very few resources around how to debug broken code. (This one is quite nice, and these two are worth a read as well.) 

That’s what I’m hoping to partially remedy with this article. It’s far from the single canonical process for debugging, but I hope that it helps people get unstuck while they learn. The key points I want to convey are:

  • Every data scientist hits an error messages regularly, and doing so as a new programmer is not a sign of failure
  • Isolate the issue by finding the smallest piece of code that creates the problem
  • The exact language of an error message can be extremely helpful, even if it doesn’t make sense
  • The internet is (only in this particular instance) your friend, and there are particular resources that are particularly helpful for solving problems

Continue reading

Quantifying the Value of an NHL Timeout using Survival Analysis: Part 1

I’d like to thank Luke Benz, my mentor via the Hockey Graphs Mentorship Program, for all of his help in developing this project.

Introduction

Hockey, by nature, is a fast-paced sport that can be difficult to represent by discrete situations. While most other professional sports can be viewed as combinations of distinct in-game events – at-bats in baseball, plays and series in football, and even possessions in basketball – hockey is extremely fluid, with a constantly changing game state. This difference in game flow means that there are far fewer opportunities for a hockey coach to make any decisions based on distinct game states. While, for example, a football coach has several opportunities per game to decide whether or not to attempt a fourth-down conversion, a hockey coach has very few chances to make any comparable choice that can affect the outcome of the game. However, there are a few tools available to a hockey coach that can be researched so as to optimize their effectiveness in helping a team to win a game.

The most-researched of these decisions (thus far) for an NHL coach is when to pull the goalie in an endgame situation. There have been several papers published regarding the optimal time to pull the goalie, such as these two by Beaudoin and Swartz in 2010 and by Brown and Asness in 2018. (For even more great work on goalie pull times, you can check out Meghan Hall’s talk from the 2019 Seattle Hockey Analytics Conference and her Tableau dashboard, as well as the Goalie Pull Twitter Bot created by Rob Vollman and MoneyPuck.com.) All of this prior research has found that NHL teams should pull their goalies much sooner than conventional wisdom suggests, as teams are much more likely to score to tie the game if they pull their goalie earlier rather than later.

However, beyond pulling the goalie, there are still a few more tools at a coach’s disposal. Teams are allowed to challenge goals for certain rule infractions, use a 30-second timeout during a stoppage in play, or switch goalies if the starter is having a bad game, in addition to personnel decisions regarding line combinations or matching up players against the other team. This article focuses on timeout usage, but I plan to explore the other tools in future work.

Continue reading

The State of Goalie Pulling in the NHL

When people ask me how to get into sports analytics, I always suggest starting with a question that they’re interested in exploring and using that question as a framework for learning the domain knowledge and the technical skills they need. I feel comfortable giving this advice because it’s exactly how I got into hockey analytics: I was curious about goalie pulling, and I couldn’t find enough data to satisfy my curiosity. There are plenty of articles on when teams should pull their goalies, but aside from a 2015 article on FiveThirtyEight by Michael Lopez and Noah Davis, I couldn’t find much data on when NHL teams were actually pulling their goalies and if game trends were catching up to the mathematical recommendations. I presented some data on the topic at the Seattle Hockey Analytics Conference in March 2019, but the following analysis is broader and includes more seasons of data.

Data collection notes

  • All raw play-by-play data is courtesy of Evolving-Hockey and their scraper.
  • Data includes all regular season games from 2013-14 onward. All 2019-20 data is up until the season pause, through March 11, 2020.
  • Only the first goalie pull per team in each game is counted for the average times. For example, if a team pulled their goalie while trailing by two and then later in the game pulled their goalie again while trailing by one, only the first instance is included in the average times. All extra attacker time is counted for the scoring rates.
  • More details on this data set, particularly at the team level, is available here.
Continue reading

Introducing NWHLe and Translation Factors

In April 2017, Rob Vollman tweeted out what he called “rough and preliminary” translation factors for women’s hockey. At the time, I was playing around with counting stats from two years of NWHL and CWHL hockey, and wanted to develop as many tools and resources as I could to better understand the women’s game. Curious to know what the competitive landscape of post-collegiate hockey looked like in North America and elsewhere, I began to keep track of data with the intention of building on Rob’s translation factors.

The world of women’s hockey in North America has changed dramatically in the three years since Rob’s tweet. My initial plans went up in smoke when the CWHL suddenly folded after the 2018-19 season. As a result, I shifted my focus to developing NWHL equivalency factors – or NWHLe – for NCAA DI, NCAA DIII, and USports. Unfortunately, it quickly became apparent that the sample size of USports alumnae to play a significant number of games in the NWHL was too small to work with.

Continue reading

Using Sequences for Analysis: Expected Goals Contribution and more

In a previous article, I presented a way to cut and slice a hockey game into Sequences. A Sequence extends from the moment a team gets control of the puck and starts moving forward, to the moment the team loses it for good. The objective was to measure the importance of every event happening between the beginning of a Sequence and its end, from a zone exit to any shot attempts, to a zone entry or any high-danger passes in between. If a Sequence includes one or several shot attempts, its value is the sum of the Expected Goals of all those attempts.

The natural follow-up was the creation of an Expected Goals Contribution metric for players.

The thinking behind it was to answer one of the two main questions we face in the daily use of analytics with coaches: What is the real contribution of each player? Overall, there are the well-known GAR or WAR type of metrics, but these are beyond the comprehension of many staffs as they are not tangible enough for a daily use.

Now, if we use Sequences where the team has possession of the puck, it means Expected Goals Contribution would only look at the offensive side of the game. Still, instead of looking separately at transition or shooting stats to evaluate a player, the objective is to sum all offensive efforts into one metric, weighting those efforts (zone exit, entry, etc.) according to their contribution to the Sequence. It also makes playmaking more apparent statistically.

In other words, it means sharing the total value of the Sequence (in terms of Expected Goals), between the players responsible. This is what we called Expected Goals Contribution.

Continue reading