
When do women’s hockey players reach their peak? How do they develop? These questions may sound straightforward, but they are exceedingly difficult to answer because of the finite opportunities for players to pursue high-level post-collegiate hockey. There is no consensus “top” professional league in the world, and major international tournaments are brief; conclusions we draw from them can be heavily skewed by the group format.
For all these reasons and more, NCAA DI (Division I) is a logical place to explore player development. It is data-rich, relative to the rest of women’s hockey, and Carleen Markey’s work with aging curves placed CWHL (Canadian Women’s Hockey League) skaters’ peak offensive production between the ages of 22 and 23. That falls within the range of many collegiate careers.
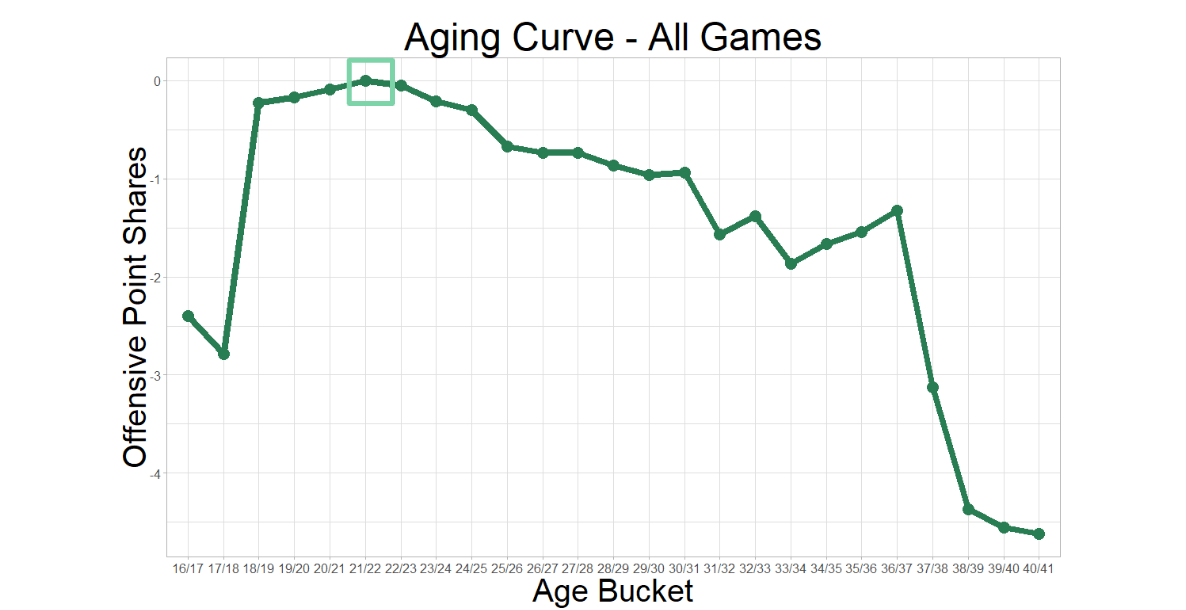
Credit: Carleen Markey
The Pipeline
The zenith of skill and competition in the world of women’s hockey are the Olympics and the IIHF Women’s World Championship. These tournaments are filled with, and often dominated by, active DI players and alumnae. As one might expect, the majority of those players represent Team USA and Team Canada.
At the 2019 Worlds in Espoo, Finland, all of Team USA’s roster and 20 of the 23 players on Team Canada spent at least one year in an NCAA DI program, compared to just five of the 23 players on Team Finland’s silver medal-winning team, and one player on Team Russia’s fourth-place team.
That said, there are more international players playing college hockey in North America every year. Per biographical data on EliteProspects.com, the ratio of international players in DI hockey climbed from 4.17 percent in 2015-16 to 5.07 percent in 2019-20.
Those percentages don’t mean much without the context of the women’s hockey landscape across the globe. According to the IIHF, there are 88,732 registered female players in Canada and 82,808 in the U.S. Outside of North America, there are 26,381 registered players in Sweden, Finland, Czech Republic, Russia, France, Germany, Switzerland, Japan, and Norway combined.
Expectations
Before I dug into the numbers, I expected to see the most significant jump in production and overall impact (measured by game score) for skaters between the ages of 20 and 21 — which roughly encompasses most skaters’ sophomore and junior seasons. My reasoning: many skaters are given more ice time and opportunity in their junior seasons.
When testing the repeatability of game score between forwards and defenders (and F/D), I noticed a clear trend in estimated time on ice per-game (eTOI/GP). The same forwards who averaged 14.3 eTOI/GP as freshman averaged 16.47 eTOI/GP in their senior seasons. For defenders, freshmen averaged 17.63 eTOI/GP and seniors averaged 19.62 eTOI/GP. Generally speaking, DI coaches trust juniors and seniors with more ice time than they do underclassmen.
The eTOI (estimated time on ice) data on Dave MacPherson’s site pick224.com proved valuable here. Utilizing rate statistics with eTOI levels the playing field for freshman and sophomore skaters. Unfortunately, we don’t have even strength eTOI, but we can still look at game score and production rates per game.
Trends
I collected data for game score and offensive production by age for the 237 skaters who played four seasons of DI hockey between 2015-16 and 2019-20. My objective was to look at two cycles of players and how they developed through their college hockey career. While there are more sophisticated ways to look for trends in development, this approach suited my needs given the data that was available.
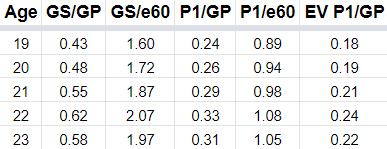
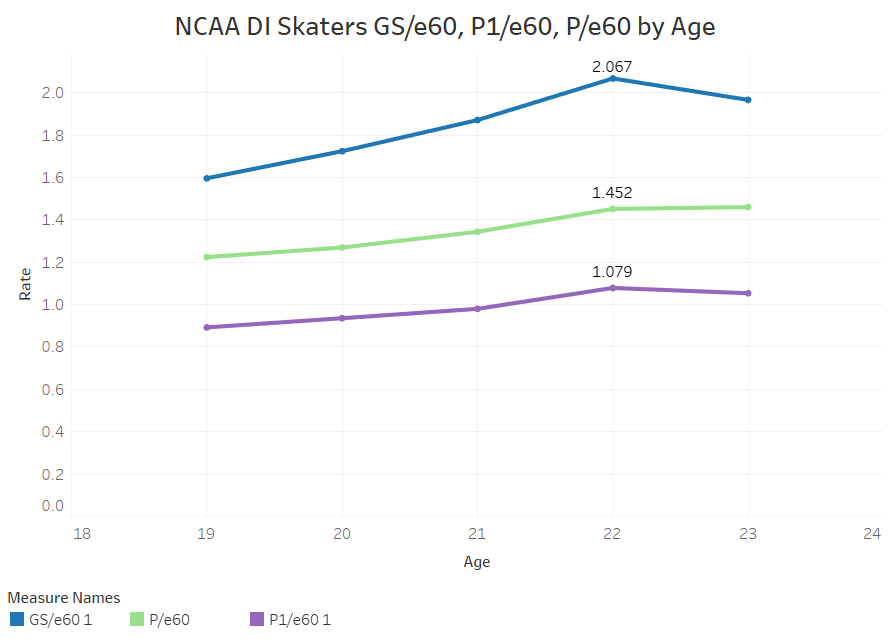
Contrary to my expectations, the biggest increase in impact and production occurred between the ages of 21 and 22, followed by the transition from age 20 and 21.
It’s important to note that the dip in both game score and production in 23-year-old skaters is influenced by a small sample size (66) — every other age had at least 176 skaters in its sample. With that being said, this trend in impact and offense lines up with Markey’s work on aging curves in a professional, post-collegiate setting.
This steady climb is not exclusive to game score and rates of production. However, this rule doesn’t apply to shooting percentage, which held relatively steady before exploding to 8.75 percent at age 22. It’s highly unlikely that players suddenly become more adept at shooting at 22. I don’t know about you, but I feel like this is likely the cause of factors including, but not limited to, power play opportunity and, of course, luck.
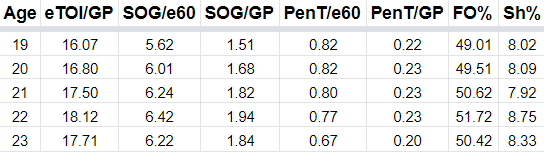
It’s nifty to see faceoff percentage rise so clearly with age. It makes sense that college players adapt and improve in faceoffs over the course of their career after having a crash-course as freshman teenagers. The jump from high school and junior hockey to NCAA DI hockey is substantial. The struggles of 19-year-olds at faceoffs at the DI level is just another bit of evidence supporting that.
Conclusions
We stand to learn a great deal by investing time and research into player development in women’s hockey. Beyond trends in things like game score and offensive production, we can also identify markers that could forecast elite players. For example, 12 of the 16 players with a GS/e60 north of 4.0 at the ages of 21 and/or 22 in this study also had an GS/e60 greater than 3.5 at the ages of 19 and/or 20. And that’s without factoring in things like strength of teams and conferences.
These markers and trends in development should come into greater focus with larger sample sizes and more years of data. The same will be true when more data is made available to the public. Needless to say, having even strength time on ice would go a long way in eliminating the influence of special teams and Corsi would give us another data point to use in quantifying the impact of defenders.
Much of the work that’s being done in women’s analytics borrows from blueprints that were developed for the analysis of men’s hockey — specifically the NHL. But all of the blueprints in the world won’t matter if the gap in resources and available data remains the same.
We all know that women’s hockey is a rapidly growing sport. In the U.S. alone, the number of registered players has soared from 6,336 in 1990 to 82,808 in 2020. But our understanding and analysis — data-driven or otherwise — of the sport has failed to grow at the same rate. This look into player development is rough and in need of polish, but, hopefully, it’s a step in the right direction.
