
In July of 2016, Dom Luszczyszyn released a metric called Game Score. Based on the baseball stat created by Bill James (and ported to basketball by John Hollinger) the objective of game score is to measure single game player productivity.
While it’s often easy to compare players across larger sample sizes, comparing two different players’ performance on a given night can be difficult. If player A has a goal, two shots, and took a penalty, did that player outperform player B who had two assists and one shot? Game score attempts to answer that question by weighting each of the actions of each player to give us a single number representing their overall performance in that game.
Unlike Dom, whose main goal was to create a better way to evaluate single game performance, mine was to create a better statistic to evaluate the total contributions of players. There are no advanced metrics, like Corsi For percentage, or even Goals For percentage, available at this time in the NWHL. Because of this, points are the best way to evaluate players, even though other box score stats are available.
Method
The first step to creating a Game Score metric for the NWHL is figuring out what stats to use. Dom’s Game Score includes goals, assists, shots on goal, penalties drawn and taken, faceoffs won and lost, blocked shots, 5v5 goal differential, and 5v5 Corsi differential.
Unfortunately, the NWHL does not keep all of these stats. The league does have a record of goals, assists, shots on goal, penalties taken, and faceoffs won and lost. They also track blocked shots, but there seemed to be an error in the data for the 2015-16 season where only a handful of players were credited for blocked shots, so I left them off for now. Perhaps only one arena tracked them for only a portion of the season. In the near future, they can be added in.
The next step is to create weights for each stat. Similar to Dom, I took the frequency of each stat to goals. For example, there were 4338 shots on goal between the 2015-16 and 2016-17 seasons, and 461 goals. Take the 461 goals and divide them by the 4338 shots on goal, and you get the factor of .11.
The only time we differ from this method is for penalties. When including goals of all strength, penalties hold about the same weight as assists. Dom noticed this in his NHL game score and compared penalties to powerplay goals per 60 minutes. Similarly, I took the frequency of powerplay goals to penalties, otherwise known as PP%.
Where Dom and I differ the most, is faceoffs. He was able to draw from previous work at War On Ice, and used their goal conversion for faceoffs. Unfortunately, I was unable to do this. For consistency sake, I kept faceoffs as is.
The formula for skater game score looks like this:
Skater Game Score = G + (.64*A) + (.11*SOG) + (.12*FOW) – (.12*FOL) – (.17*PEN)
For goalies, I used only saves and goals against, and scaled the results to be within a reasonable range of skater game score per game. Without doing this, goalies become very undervalued.
Goalie Game Score = (.14*SV) – GA
Testing
As mentioned above, my goal is not to create a metric just to evaluate individual games, but to build a statistic that can incorporate more box score stats than just points. If game score is more repeatable than points, that may suggest it paints a better picture of how well a player performs. Points are often influenced heavily by variance, and with the NWHL’s length of schedule being only a fourth of the NHL schedule, shooting luck will play an even greater role.


As you see above, game score has been a more repeatable metric than points, however, it seems as though that is driven by a very small number of outliers. Due to such a small sample size of players who have played both completed seasons so far, we are unable to draw any conclusions on the strength of game score over points.
This is probably due to a very strong correlation between points and game score, as not only are points an input into the game score formula, but the biggest inputs.
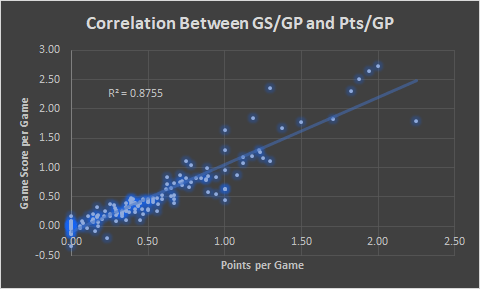
Game score doesn’t re-invent the wheel, but provides an incremental improvement in player evaluation. Once we are able to add other inputs like blocked shots, perhaps we will see a weaker correlation between game score and points, where we can once again test to see how game score stacks up to points.
Weaknesses
One of the weaknesses of game score is that it favors centers who log lots of ice time and win lots of faceoffs. Even though their faceoff wins hold value for their teams, other skaters are set at a disadvantage as they do not have the opportunity to take those faceoffs. One player who has benefited from this is Kelli Stack. In the 2015-16 season, Stack recorded a game score per game of 2.35, while teammate Kelly Babstock recorded a game score per game of 1.30. This is despite Stack recording 1.29 points per game, just slightly better than Babstock at 1.20. They both dominated in the faceoff circle, but Stack took 422 faceoffs compared to Babstock’s 218.
Another weakness is that game score favors volume shooters. Playmakers who live off of passing the puck, have less of an opportunity to achieve a high game score. The only way to achieve game score by passing the puck is to get an assist. By shooting the puck, you can get a shot on goal and/or a goal. There are no absolute playmakers that never shoot the puck, but there is a comparative advantage in shooting the puck over passing it to a teammate.
In the NHL there are players who can offset the high volume of penalties they take with drawing an equal amount of penalties. Since the NWHL does not have record of penalties drawn, we are not able to pick out those players. Even a player who only takes one penalty all season will have a negative game score when it comes to penalties, even though she would have a net positive game score if she drew five.
Future Work
The NWHL has plans to improve on the metrics they track in the future, and it is important to remember how new the league is. As mentioned above, blocked shots can be added to the game score formula in the near future. The league will also eventually track on-ice events like goal differential and Corsi differential, and once that happens, they can also be added to game score. As more and more data is collected, it will remain important to retest, and improve upon the metric to continue to refine it into a better measure of player ability.
