
Carleen Markey broke new ground with her presentation on women’s hockey aging curves in the CWHL (Canadian Women’s Hockey League) at RITSAC 2019. Her work, which was built from the scaffolding of the Evolving Wild twins’ aging curves, established that offensive production among CWHL skaters peaked around age 22 to 23. That work by Markey got me thinking about how players developed just before going pro in North America and Europe, and/or becoming fixtures on national teams.
So, I set my eyes on NCAA DI (Division I) women’s hockey.
DI schools have served as the primary pipeline of talent for Team Canada and Team USA for decades. Furthermore, DI schools have served as a valuable proving ground for many of the most talented European players in the world. With Carleen’s work in mind, I set out to analyze how skaters developed in DI hockey before they reached their peak production years and their athletic prime.
Approach
The greatest obstacle to any statistical analysis of the women’s game is the scarcity of public data. Fortunately, NCAA DI is something of an exception because of sites like collegehockeystats.net, collegehockeynews.com, and the database on HockeyEastOnline.com.
I decided on developing a game score for DI hockey to serve as an all-in-one stat that could provide a rough measure of a player’s overall impact or value. Dom Luszczyszyn first applied game score to hockey, and his work provided a framework. Creating game score for DI hockey was also appealing because I was able to apply lessons learned from working with Shawn Ferris’ NWHL (National Women’s Hockey League) game score. At the time, this sounded like fewer headaches for me. I was wrong; I had forgotten how many headaches there were the first go around.
To be clear, there were other tools I could have cobbled together to analyze player development; this is simply the path that I chose. I considered point shares and other methods, but I liked that game score considered numbers relevant to defensive skill for a single value statistic.
I started by manually mining data from the last five Division I seasons. I chose to work with five seasons instead of four to have two different four-year cycles. Opting for five seasons also allowed for the inclusion of players who missed the 2017-18 season because they were centralized with national teams for the Olympics as well as some players who redshirted a year as a result of injury or transfer.
Unfortunately, I had to exclude players from NEWHA (New England Women’s Hockey Association) schools because the conference joined DI in 2017-18 and data for those schools isn’t on par with the rest of DI.
Just a few days after I finished mining, I discovered Dave MacPherson’s site for the first time. His site had almost everything I had mined and more. So, after laughing myself to tears and screaming unspeakable obscenities into the naked night sky, I brightened up upon considering the potential of incorporating even strength on-ice goal data into the formula, and working with eTOI (estimated time on ice). So, I got to work. After the tears had dried.
Game Score
Improvisation, innovation, and patience are all essential ingredients when creating tools to work with data in women’s hockey. It’s a lot like building a desk that you ordered from IKEA but having only a bag of rubber bands, popsicle sticks, and gumption to slap it together. Stripping-down tools developed for NHL analysis for women’s hockey was nothing new to me. It also helps when you can pester people like Dom Luszczyszyn and Shayna Goldman with questions.
I pieced together the formula using data from all DI players (including NEWHA) across the past five years so I could determine the weights of each stat relative to its frequency to goals. I included goals, primary assists, secondary assists, shots on goal, blocks, faceoffs won and lost, penalties taken, and on-ice even strength goals for and against. I parted ways with Dom’s methodology for his NHL game score largely out of necessity. I excluded penalties drawn, Corsi For, and Corsi Against because they were not publicly available. I also used Shawn’s method of weighing penalties based on league-wide power play percentage.
Skater game score: G+(0.92*A1)+(0.68*A2)+(0.086*SOG)+(0.086*Blk)+(0.091*FOW)-(0.091*FOL)-(0.16*PENT)+(0.2*EV GF)-(0.2*EV GA)
I didn’t stray from Dom’s methodology for goalie game score, though. I played with the weighted value of a save until goalie game scores were in the same neighborhood as skaters.
Goalie game score: (0.145*Sv)-(GA)
It should also be noted that, unlike Dom, I didn’t scale the weights down for either formula to make game score similar to point totals. This was purely an aesthetic choice. It also meant slightly less math, which I have always found to be immeasurably satisfying.
Testing
Keeping in mind that I wanted to use game score as a value to summarize a player’s overall impact at different stages during their collegiate career, I wanted to be thorough in my testing. So, I decided to test its repeatability against both P/GP and P1/GP between multiple seasons to discern its repeatability over the course of a DI college career.
I did some tidying up by excluding players who played three of the possible four seasons as well as those who played under 15 games in any season. In the event of a player redshirting due to an injury, I excluded the season in which the injury occurred to have four seasons to work with. This whittled my initial sample down from 305 skaters to 267.
First, I tested to see if primary points were more repeatable than points, which was the case when I previously worked with NWHL data. I did this primarily to add context to game score’s potential value.
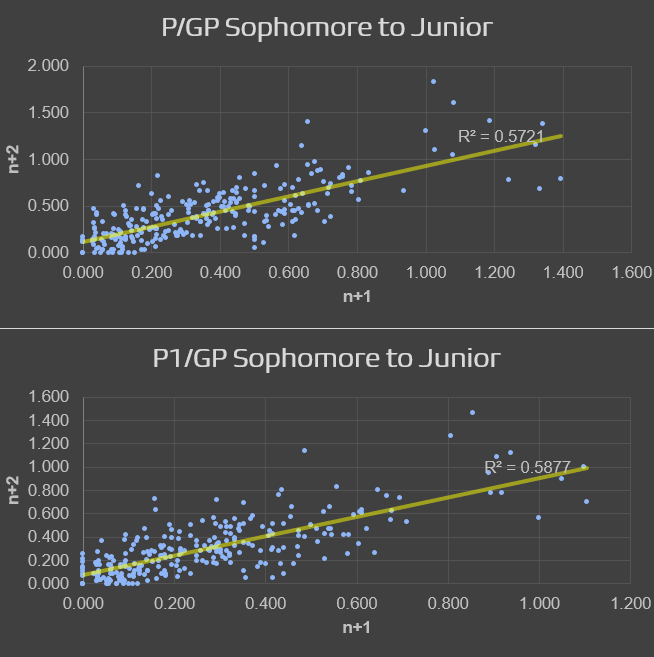
As expected, primary points had greater repeatability, but it was far closer than I thought it would be. In fact, points eked out over primary points between freshman and sophomore seasons — though P1/e60 was superior to P/e60. The repeatability of primary points improved the further away it was tested from the freshman season. I suspect this has something to do with ice time, deployment, and faceoff data — a sample of 184 forwards from my study had a collective faceoff percentage of 48.42 as freshmen and 51.47 as seniors. It could also mean that the weighted values in the formula require more polish.
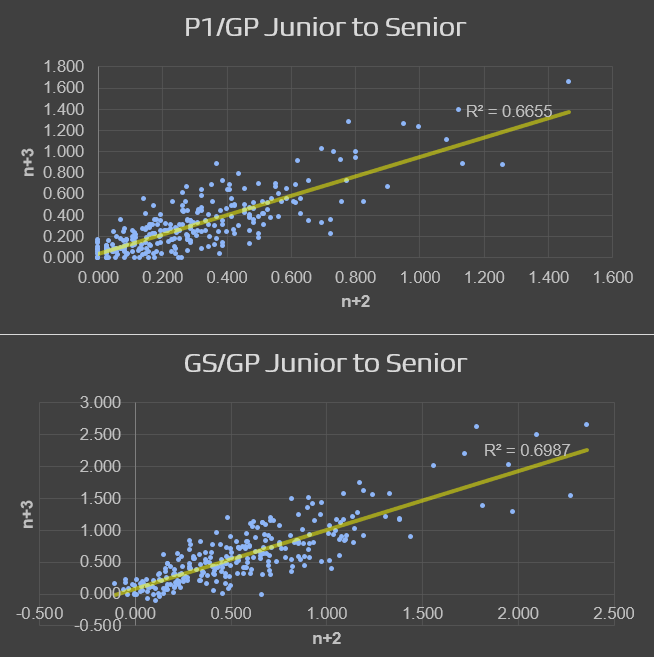
Next, I tested the repeatability of game score. Reassuringly, the margins between the correlations were significantly greater than those between points and primary points. The strongest correlation in all of my testing was GS/GP between junior and senior seasons — which aligns with Carleen’s work with aging curves and point shares at the pro level. Average game score also had greater repeatability than P1/e60, which suggests that the factors outside of offensive production hold significant value to repeatability despite having a fraction of the value of goals and primary assists.
As expected, the repeatability of goaltender game score left a lot to be desired. With that being said, it did prove more repeatable (R²=0.2606) than all-situations save percentage (R²=0.1847) and GSAA/60 (R²=0.2395).
Limitations and Potential
The limitations of game score for DI women’s hockey are abundant.
First, let’s state the obvious: the absence of penalties drawn, Corsi, and other data are all holes in the sail of its ability to serve as a reliable all-in-one stat. Even though the data we have for DI women’s hockey is rich relative to what’s available at the pro level, there’s simply not enough of it being collected, let alone being made public.
There is other data available to work with like iCF and iFF (individual Corsi For, Fenwick For) by strength, which is available at collegehockeynews.com. But beyond that and some basic situational scoring data, it’s a desert.
Now, for the slightly less obvious: there’s a clear bias for productive skaters, especially forwards. Data-driven analysis of defenders is notoriously difficult in women’s hockey because of the scarcity of relevant stats. Blocked shots and plus/minus will only get you so far.
To determine the severity of this bias I separated players who exclusively played a forward position for four years from those who were classified as either a defender or a F/D — it broke down to 161 forwards and 93 defenders. I then tested the repeatability of game score between the two groups.
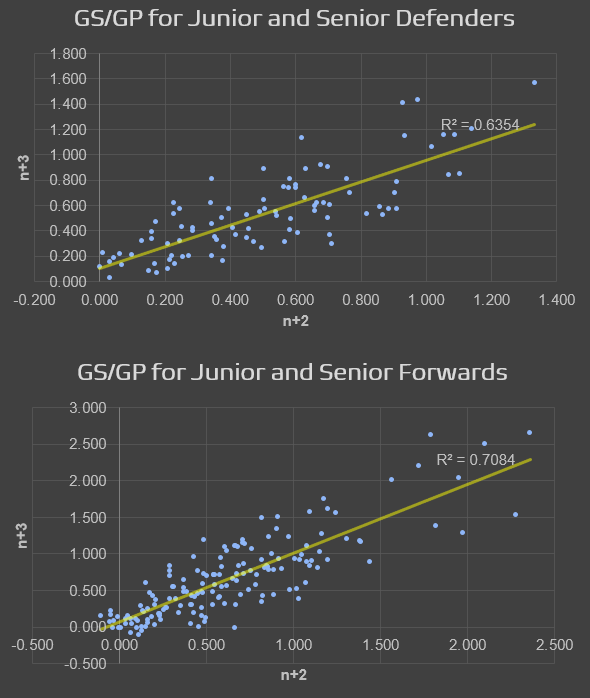
The difference in the correlations speaks for itself. Game score is a lot more repeatable for forwards, and it’s not close.
Another big knot to untie is conference strength. There’s a difference between scoring 25 goals in a season while playing for a school in the WCHA than scoring 25 goals playing in NEWHA. Thankfully, others are doing work being on league equivalency. Conference strength should be taken into consideration for game score, counting stats, and rate statistics. This flaw is not unique to women’s hockey, it’s just a big one that warrants mention.
The good news is that game score has the potential to tell us a lot more about a player’s influence in a game or over the course of a season than points or primary points. That, in and of itself, is progress even if the packaging is a little crude. It also accomplishes what I had set out to do: put something together that’s more insightful for understanding development than points. An all-in-one stat like game score can open a lot of doors and expand our understanding of the women’s game at this level. As Dom wrote four years ago: “Consistency, streakiness, clutchiness; whether they’re real or random is a question a stat like Game Score can help answer and one that we perhaps couldn’t answer properly beforehand.” DI women’s hockey game score can help us answer the question “who had the best game” and, hopefully down the line, a lot more.
