
The NHL Draft acts as the proverbial reset of the NHL calendar. Teams re-evaluate the direction of their organizations, make roster decisions, and welcome a new crop of drafted prospect into the fold. Irrespective of pick position, each team’s goal is to select players most likely to play in the NHL and to sustain success. Most players arrive to the NHL in their early 20s, which leaves teams having to interpolate what a player will be 4-5 years out. This project attempts to address this difficult task of non-linear player projections. The goal is to build a model for NHL success/value using a player’s development — specifically using all current/historical scoring data to estimate the performance of a player in subsequent seasons and the possible leagues the player is expected to be in.
Predictive Modelling
The Goal Impact of Even Strength Faceoffs for NHL’s top 100 Faceoff Centres

“Jackets-Canucks Face-off” by Leech44 – Own work. Licensed under CC BY-SA 3.0 via Wikimedia Commons.
A debate was ongoing on twitter over faceoffs and their value. The debate lead to most of this data being scraped anyways, so I thought I would display everything for your viewing pleasure.
The truth is, faceoffs tend to be highly overrated. They matter, but they do not matter on average much more than any other of the many puck battles that occur throughout the game. When you really break it down, faceoffs are really just a set play puck battle after all. However, some have more values than others.
Let’s take a look.
Trading Off: How Much Possession Can My Team Surrender and Still Win?
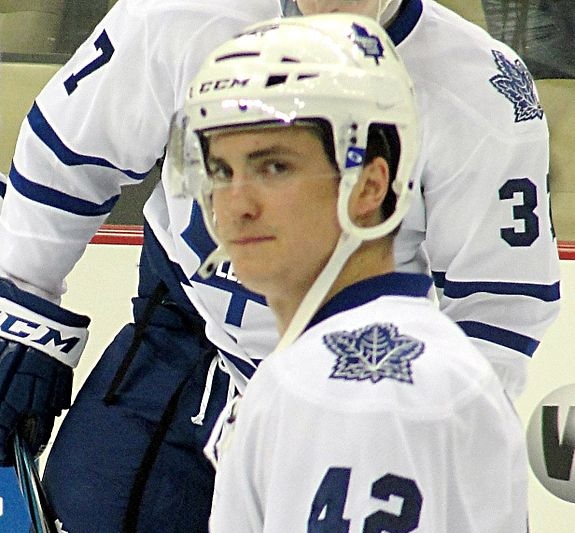
Photo by Michael Miller, via Wikimedia Commons; altered by author
Within the continuing discussions over the value of possession metrics, and the veracity of shot quality or shooting talent measures, there’s a point that seems to have slipped through the cracks. While there’s a spectrum of attitudes about possession and shot quality/talent, neither entirely refutes the importance of the other – and with that thinking, it’s worth considering how much you can sacrifice in one and still maintain success by the other. Put more simply, how little can a team possess the puck and still expect to shoot their way to success?
Continue reading
Adjusted Possession Measures
A little while ago I wrote an article at SensStats discussing score effects and suggesting a new formula which we might use to compute score-adjusted Fenwick. This article addresses several interesting questions and new avenues that were suggested to me by various commenters.
- The method in the above-linked article simultaneously adjusts for score and for venue (that is, home vs away). It’s interesting to estimate the relative importance of these two factors. As we’ll see, it turns out that adjusting for score effects is dramatically more important than adjusting for venue effects.
- We might consider adjusted corsi instead of adjusted fenwick; it turns out that adjusted corsi is a better predictor of future success than adjusted fenwick at all sample sizes.
- Most interestingly, we might consider how score effects vary over time, and see if we can create a score-adjusted possession measure that takes this variation into account. We find here that performing such adjustments is indistinguishable in predictivity from the naive score-adjustments already considered.
Several people have pointed out that score effects have a strong time-dependence. At least as far back as 2011, Gabriel Desjardins (@behindthenet) noted the effect and readers with keener memories than me will no doubt remember still earlier examples. Just last week, Fangda Li (@fangdali1) wrote an article arguing that score effects play virtually no role outside of the third period. This article will show that, while score effects are magnified as the game wears on, time-adjustment for possession calculations is not justified. Continue reading
Bayes-Adjusted Fenwick Close Numbers: Week 4

Mikko Koivu may actually really be the captain of a dominant possession team.
Two more weeks have passed since we last updated our Bayes-Adjusted Fenwick Close (BAFC) Numbers. This means we now have a lot more data and our BAFC standings are starting to really be affected by this year’s results – significant changes have happened in the last two weeks, and results from this season are starting to be thought of as actually real. Continue reading
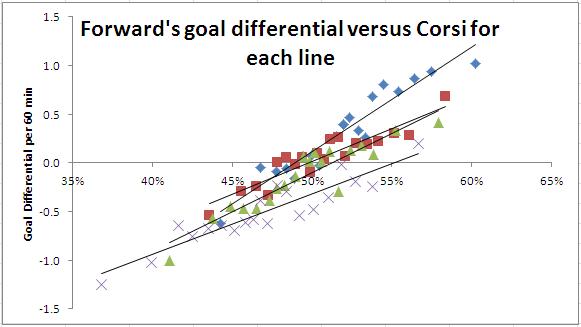
Value of Corsi possession measured in goals
The average on-ice shooting and save percentages a player experiences tends to be influenced by their average time on ice per game. This relationship likely occurs due to a combination of factors: shooting talents of linemates and opponent, defensive talents of linemates and opponent, system and psychological effects, and an effect I like to call “streak effects”.
(See bottom for discussion on these effects)
Regardless of the reasons why, these effects indicate that not all Corsi percentages are created equal in impact. This has been discussed previously on Hockey-Graphs both here and here. So, can we measure this difference in impact? Continue reading
More on “Corsi & Context”, with some added predictive modelling
INTRODUCTION
I have always been of the opinion that Corsi is part of the larger puzzle in trying to gain greater understanding of the game and how a player can affect their team’s chance to win. Like all statistics though, it needs appropriate sample size and context, and will never tell you everything. Teammates, opponents, luck, system, strategy and what moments a coach deploys a player will always effect results… although, there can also be times where context is overly stressed. While Corsi does tend to need less context than many other hockey statistics, there are some things that need to be kept in mind in how two players with the same Corsi% are not always created equally.
Tyler Dellow wrote a piece on context that is definitely worth a read. In the article Dellow used two tables showing how Corsi changes dependent on ice time for the 2011-12 season.
We will revisit this article using a larger sample and look at both forwards and defensemen.
