
Who had the best game last night?
That’s a rhetorical question obviously… because it’s July, but when hockey is actually being played from October to June it’s an important question to ask – one that’s currently not very easy to definitively answer.
Some will look at points, some will look at shot differentials, some will watch the game, but rarely is there any consensus. Different people value different things. At the top and bottom of the spectrum the answer is sometimes obvious. If Connor McDavid has a five point night, he was very likely the best guy on the ice. If Pekka Rinne lets in five goals against on 21 shots he was very likely the worst. But for many games the answer is neither obvious or simple and is generally up for debate depending on an observer’s personal value system.
What we don’t have in hockey is a standardized measurement for single game productivity. It’s not something that will end any debate, but it can provide a much better framework to answer the question over what’s currently available. And that’s what I’m going to introduce in this post.
The idea is not my own. Like most stats, the concept is completely ripped off from another sport where the question has already been answered. The sport in question is basketball, a sport I had very little interest in until this year. As a Toronto area resident I don’t think you can blame me.
Watching the Raptors go farther than they ever have before ultimately losing to the King gave me a vested interest in the game and it made me truly appreciate the complexities and dynamics of the sport. I was hooked.
Then came the NBA Finals between Golden State and Cleveland. The reason I had no previous interest in basketball was the general predictability and this finals matchup was no exception. The actual basketball played though was anything but. The final game may be one of the best sporting events I’ve ever watched and turned me into a true fan.
Needless to say, I wanted to learn as much as possible about my new interest and found myself reading a lot more basketball content, specifically about Lebron James who took his game to another level in delivering an all-time great NBA Finals performance.
That’s when I stumbled upon this article at 538 stating this was James’ best NBA Finals yet which introduced me to a basketball stat I was unfamiliar with: Game Score.
Game Score is originally a baseball stat created by Bill James, but the basketball version was created by John Hollinger. It was meant as an extension and simpler alternative of player efficiency rating (PER) and aims to “give a rough measure of a player’s productivity for a single game” with a similar scale to points scored, something the average basketball fan would immediately be familiar with. A Game Score of 40 would be outstanding (James’ game six performance netted a 44.1) intuitively because we know that a 40 point game in basketball is a damn good game. It includes every box score stat and assigns an appropriate value to it to provide a rough overall picture of how a player played during that game.
I haven’t followed basketball (or basketball stats for that matter) closely so I’m not sure whether Game Score is a good or bad stat for what it does (as it turns out, it’s not the only stat of its ilk in basketball), but the underlying idea behind it is a great one: based on everything a player did during a game, how good was his performance.
My immediate reaction was that this was something that could be applied to hockey and I wondered why it hadn’t yet (to my knowledge at least), so I decided to do it myself.
METHOD
The first step was figuring out which stats to include. For basketball’s version of Game Score the object appears to be a combination of totality, simplicity, accessibility and familiarity so I aimed to keep the same things in mind for hockey. That means nothing too advanced or complicated for the average fan and nothing you can’t find in a standard boxscore (with one obvious exception).
The stats I used are goals, primary assists, secondary assists, shots on goal, blocked shots, penalty differential, faceoffs, 5-on-5 corsi differential, 5-on-5 goal differential.
The second step is figuring out how to weigh each component. To keep things simple, I opted to weigh each stat by its frequency to goals and round up/down to keep the sig digs low. Initially I used derivatives of Matt Cane’s weighted shots model, but opted for this route instead for simplicity and to cater more towards the individual stats versus the on-ice ones (using Cane’s weights, corsi ended up explaining more of Game Score at the game level than individual points did). Realistically, there’s many ways to go about this and I don’t doubt there’s a better way, this is simply mine.
I then had to scale the weights down by 75 percent in order to make Game Score roughly equal to points, so that people would be immediately familiar with what a good or bad Game Score looks like. (Corsi, blocked shots, and faceoffs were already worth very little so they weren’t scaled back any further, especially because I superficially liked the nice round numbers).
Here’s the formula:
Player Game Score = (0.75 * G) + (0.7 * A1) + (0.55 * A2) + (0.075 * SOG) + (0.05 * BLK) + (0.15 * PD) – (0.15 * PT) + (0.01 * FOW) – (0.01 * FOL) + (0.05 * CF) – (0.05 * CA) + (0.15 * GF) – (0.15* GA)
Then there’s goaltending. I used goals against and saves, but figuring out the weights was much trickier because the player ones didn’t translate well and the overall distribution of individual games for a goalie is much different from that of a player. I kept the same weight for a goal against as a player goal, but for a save I needed to adjust it until the distribution of best goalie games roughly mirrored the best player games (ie a Game Score of 4 should be similarly attainable for both players and goalies). Using that method makes a save worth 0.1 points.
Goalie Game Score = (-0.75 * GA) + (0.1 * SV)
SMELL TEST
Now that we have our formula, let’s see whether the results make sense.
First off, let’s find the best games since 2007-08, which is thankfully made possible using Corsica’s custom query tool. To me, the best game has to be Sam Gagner’s eight point night back in 2012. It’s something that hadn’t been accomplished in over two decades and we’re in an era where it’s rare that any team scores eight goals, period. The other stats included have value… but an eight point night is an eight point night.
That game by Gagner was worth a Game Score of 7.1, indeed the highest since 2007-08, with the next highest being a seven point effort by Daniel Alfredsson in 2008. The best goalie game comes fourth, Ben Scrivens’ amazing 59 save shutout from 2014. Here’s the list of the only games since 2007-08 with a Game Score above five.

The next test is at the season level. If Game Score measures the quality of a game played, it stands to reason that the best players will play higher quality games more often, meaning over a full season the best average Game Score should belong to the best players.
Last year the per-game leader was Patrick Kane, followed by Tyler Seguin, Alex Ovechkin, Sidney Crosby and Joe Pavelski. On defence it was Brent Burns, Kris Letang, Erik Karlsson, Drew Doughty and John Klingberg. All great players with great performances last season.
Here’s who has the best per game average over the last five seasons.

For the most part I’d say it’s a decent list. Sidney Crosby leading is a good litmus test for any value stat, and the list is filled with elite forwards. Patrice Bergeron at 10th is good, but he should arguably be higher. He jumps to fourth behind Crosby, Malkin and Seguin when the on-ice stats are contextualized (relative score/zone/venue adjustments). On defence, Erik Karlsson at the top is a great sign, but not unexpected. The rest of the list is filled with some extremely good d-men. PK Subban is noticeably absent, but jumps from 11th to 7th with context.
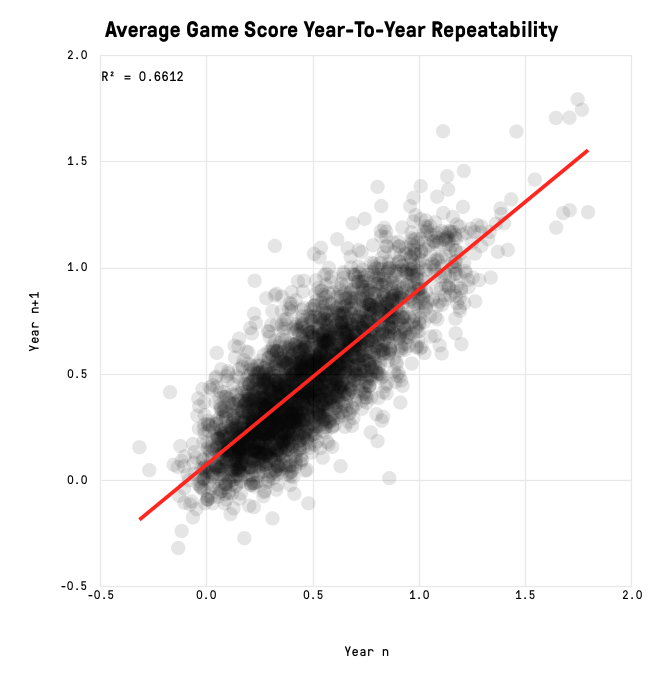
Overall, I’d say the stat does a reasonably good job at the season level which bodes well for its ability at the game level. It’s also fairly repeatable from year-to-year, although considering the stats that go into it, that’s probably not a huge surprise (the only stat included that can suffer from a lot of random year-to-year variation is 5-on-5 goal difference).
With that being said, Game Score is not without its flaws and it’s prudent that we acknowledge what it doesn’t do in order to understand what it does do.
WEAKNESSES
As mentioned above with regards to Bergeron and Subban’s ranking, context is key and Game Score is completely devoid of it. Teammates, competition, score, pace, zone starts, playing time, special teams time, team effects – none of it is accounted for. All those things will affect a player’s stats in differing ways, but Game Score ignores it.
This is by design, as the intended goal was to create a rough measurement that was simple, familiar and accessible. Factoring in all those adjustments makes the measurements more accurate, but also more complicated and less accessible (my friend some jerk literally told me yesterday he stops reading what I write when I mention adjusted corsi). At the full season level something more complicated is worth the added accuracy and could serve reasonably well as a relatively simple all-in-one stat; but at the game level simplicity is perhaps more important.
Another thing that’s missing is on-ice stats for special teams. Players get credit for individual stats accumulated, but nothing at the team level which is a pretty sizeable gap in missing data. In all honesty, I wasn’t sure how it could be accounted for in a simple yet effective manner and that’s why it was ignored completely.
Then there’s the issue of defence. The on-ice differential data helps, but Game Score is very much driven by offensive contributions which means some defensive players will be very underrated. In this case, we’re limited by what’s available in the NHL’s play-by-play data and there simply aren’t many defensive stats to use.
The final issue I see is in net. We know by now there’s more nuance to a goalie’s game – that shot location matters, that penalty killing save-percentage is very random, etc – but that’s not accounted for here. Really, Game Score for goalies is just to place them on a level playing field with players and to see whether a goalie stole a game, lost a game, or if he was just solid. There are better ways to evaluate how he played, this just puts it in relation with the rest of his team.
CONCLUSION
That’s Game Score in a nutshell. It’s not a perfect stat – it’s meant to be a rough measure after-all – but I do think it works well for its intended purpose and is effective at what it does. It’s meant to answer “who had the best game” by adding proper perspective to a combination of a player’s total contributions and into an easily understood all-in-one stat.
There’s many applications for Game Score across hockey analysis that I think can further our understanding of the sport and how players work at the game level. Consistency, streakiness, clutchiness; whether they’re real or random is a question a stat like Game Score can help answer and one that we perhaps couldn’t answer properly beforehand.
Game Score is nothing earth-shattering, but I do think it fills a gap in hockey analysis towards measuring single game productivity in a more effective manner.
***
All data comes via corsica.hockey. A dropbox link to Game Score for every game since 2007-08 can be found here.

Very interesting analytic. On the right track. Thank you
Well this certainly explains things like the last 5v5 All Star Game. It’s a useful rating as far as it goes, I guess. When you get into the top tier players in any sport, the difference between who’s better and who’s best is so small I doubt you’ll ever get consensus on it. And when those players cross over long time spans the view is even blurrier. Is Connor McDavid better than Sidney Crosby? Is Crosby better than Mario Lemieux? Was Lemieux better than Gretzky better than Gordie Howe? Good luck with that.
Is Game SCORE Aavailable for 2017+ seasons ?
This is a simple way to quantify offensive contribution.
The challenge remains in identifying defensemen’s performance indicators to include in the equations.
hi i am doing a school project and I tried to replicate your calculations using the formula you created and I cannot get any of the player GS that you have done to match. Can you provide actual calculated examples so I can understand how you are coming up with Sam Gagner with a 7.1 – i am getting 7,25 following your formula
Wow, great read.