
In a previous article, I presented a way to cut and slice a hockey game into Sequences. A Sequence extends from the moment a team gets control of the puck and starts moving forward, to the moment the team loses it for good. The objective was to measure the importance of every event happening between the beginning of a Sequence and its end, from a zone exit to any shot attempts, to a zone entry or any high-danger passes in between. If a Sequence includes one or several shot attempts, its value is the sum of the Expected Goals of all those attempts.
The natural follow-up was the creation of an Expected Goals Contribution metric for players.
The thinking behind it was to answer one of the two main questions we face in the daily use of analytics with coaches: What is the real contribution of each player? Overall, there are the well-known GAR or WAR type of metrics, but these are beyond the comprehension of many staffs as they are not tangible enough for a daily use.
Now, if we use Sequences where the team has possession of the puck, it means Expected Goals Contribution would only look at the offensive side of the game. Still, instead of looking separately at transition or shooting stats to evaluate a player, the objective is to sum all offensive efforts into one metric, weighting those efforts (zone exit, entry, etc.) according to their contribution to the Sequence. It also makes playmaking more apparent statistically.
In other words, it means sharing the total value of the Sequence (in terms of Expected Goals), between the players responsible. This is what we called Expected Goals Contribution.
Inspired from Soccer
The notion of Expected Goals Contribution has not yet been explored in hockey. The idea of giving credit to players involved ahead of the shot has been studied in soccer, with the notion of xG Chain or xG Buildup that removes the shot from the equation and only consider what happened before. However, those metrics equally share the total value of the sequence between all players involved, no matter their implication, whether they touched the ball once or ten times. I thought it a bit unfair, and thus laid out the philosophical groundwork for our Expected Goals Contribution as it shares the Sequence value between the events, depending on how important the event was to the creation of the shot(s).
Using Events Potential Value
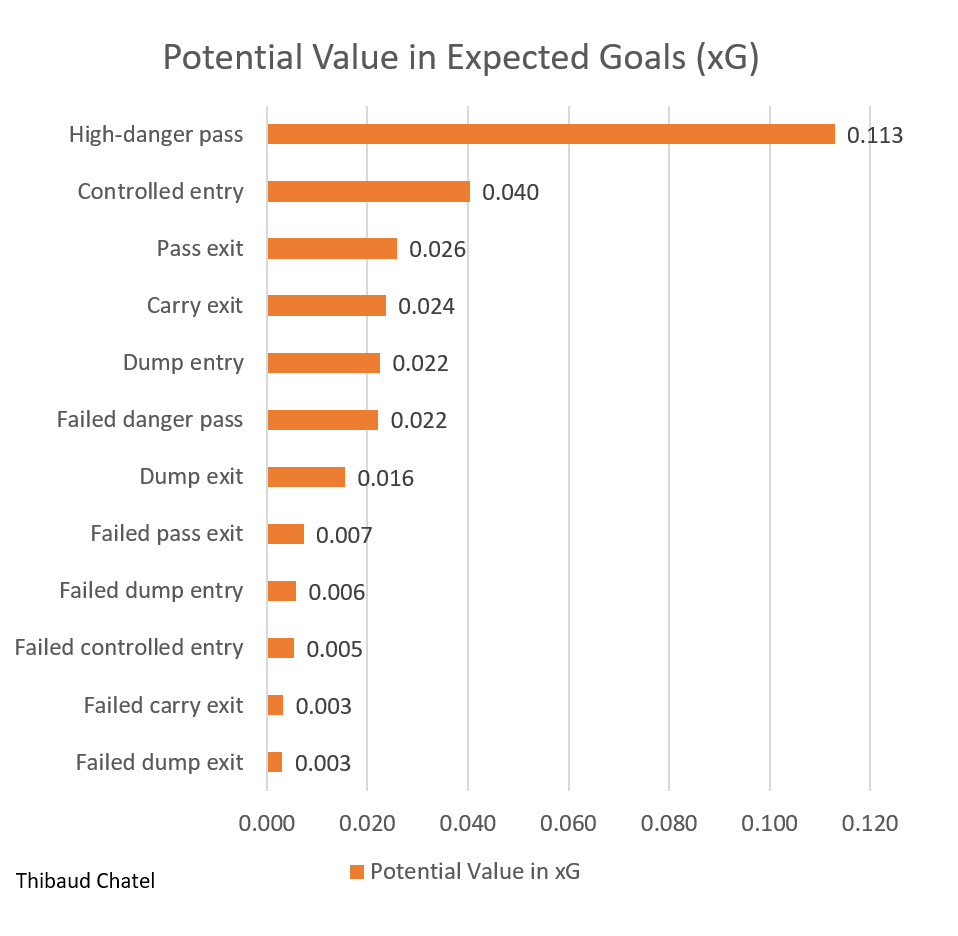
In the previous article, a value was given to all type of events in a Sequence, based on how many Expected Goals they produce in average and how often they lead to a shot attempt.
Now, one point that was not mentioned in the first article is shot assists. How could I give a value to a shot assist? My initial thought was to compare the impact on shot value with and without a shot assist in terms of Expected Goals. In my dataset, having a shot assist makes shot attempts just 3% more valuable (0.046 Expected Goals on average vs 0.045 without).
I found this article by Ryan Stimson on the impact of passing on shot quality. In the article, shooting % without previous passing is at 8%, comparing to 7.2% without previous passing. Which means the assist makes the shot at least 11% more valuable. I went back to my data and compared Corsi shooting % (I do not have shots on goal), and it is 4.8% with passing versus 2.1% without. The difference is huge, but I am using shot attempts while Ryan used shots on goal, which is likely where the difference lies. I opted to stick to my data and original thought and give 3% of the shot value to the assist. It may seem like a small difference, but often small differences in the numbers can have a large difference in the final output.
How can we share the value of a Sequence?
Based on this, we can follow the potential value of each event included in a Sequence, as defined earlier.
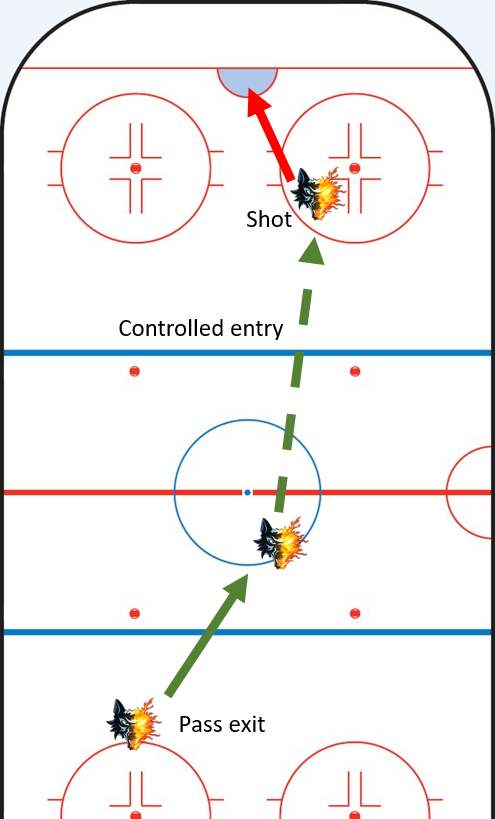
Let’s use a simple example from a Grenoble Brûleurs de Loups game in France:
-
-
-
- Successful pass zone exit: potential value 0.026 xG
- Controlled zone entry: potential value 0.040 xG
- Shot attempt in the scoring chance area: potential value 0.085 xG
-
-
To establish their relative importance, we divide each event by the total potential value (the sum of each events’ potential value).

The sequence has a total value of 0.085 Expected Goals, as only one shot happened, so we can share it as follows:
- Pass zone exit: 17% of 0.085 = 0.0146 xG Contribution
- Controlled zone entry: 26% of 0.085 = 0.0225 xG Contribution
- Shot attempt (no shot assist): 57% of 0.085 = 0.0478 xG Contribution
Let’s now look at a more complex example with a sequence that includes the following:
- Carry exit
- Controlled entry
- Successful danger pass (though not leading to an immediate shot)
- 3 shot attempts (2 with a shot assist)
- Total expected goal for this sequence is 0.044 xG
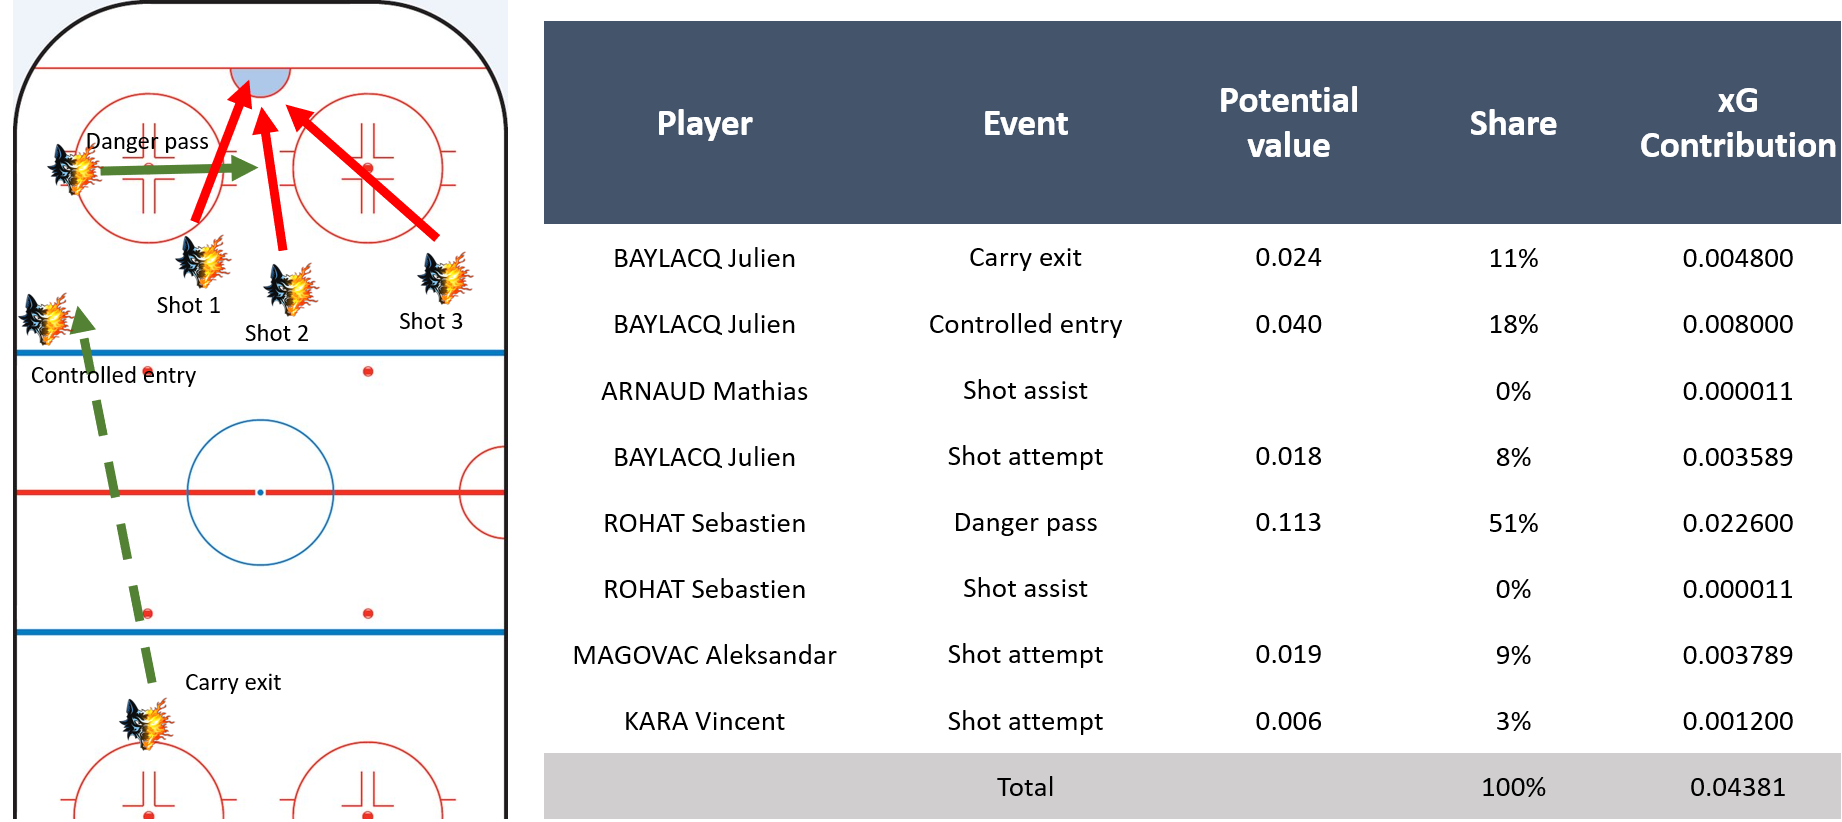
In the end, both the exit and the entry have more value than any of the 3 shot attempts. These were low danger shots; both the exit or the entry were successful and could have led to something more dangerous. It is the same for the high-danger pass, which holds 50% of the sequence value as it was the most dangerous event in the sequence.
We added Grenoble’s players involved in this Sequence, to be able to calculate the “Expected Goals Contribution”. Julien Baylacq gets credit for the exit, the entry, and one of the shots for a total 0.0164 Expected Goals Contribution. Sebastien Rohat gets credit for for his dangerous pass and a shot assist for a total 0.0226 Expected Goals Contribution.
What Do We Do With This?
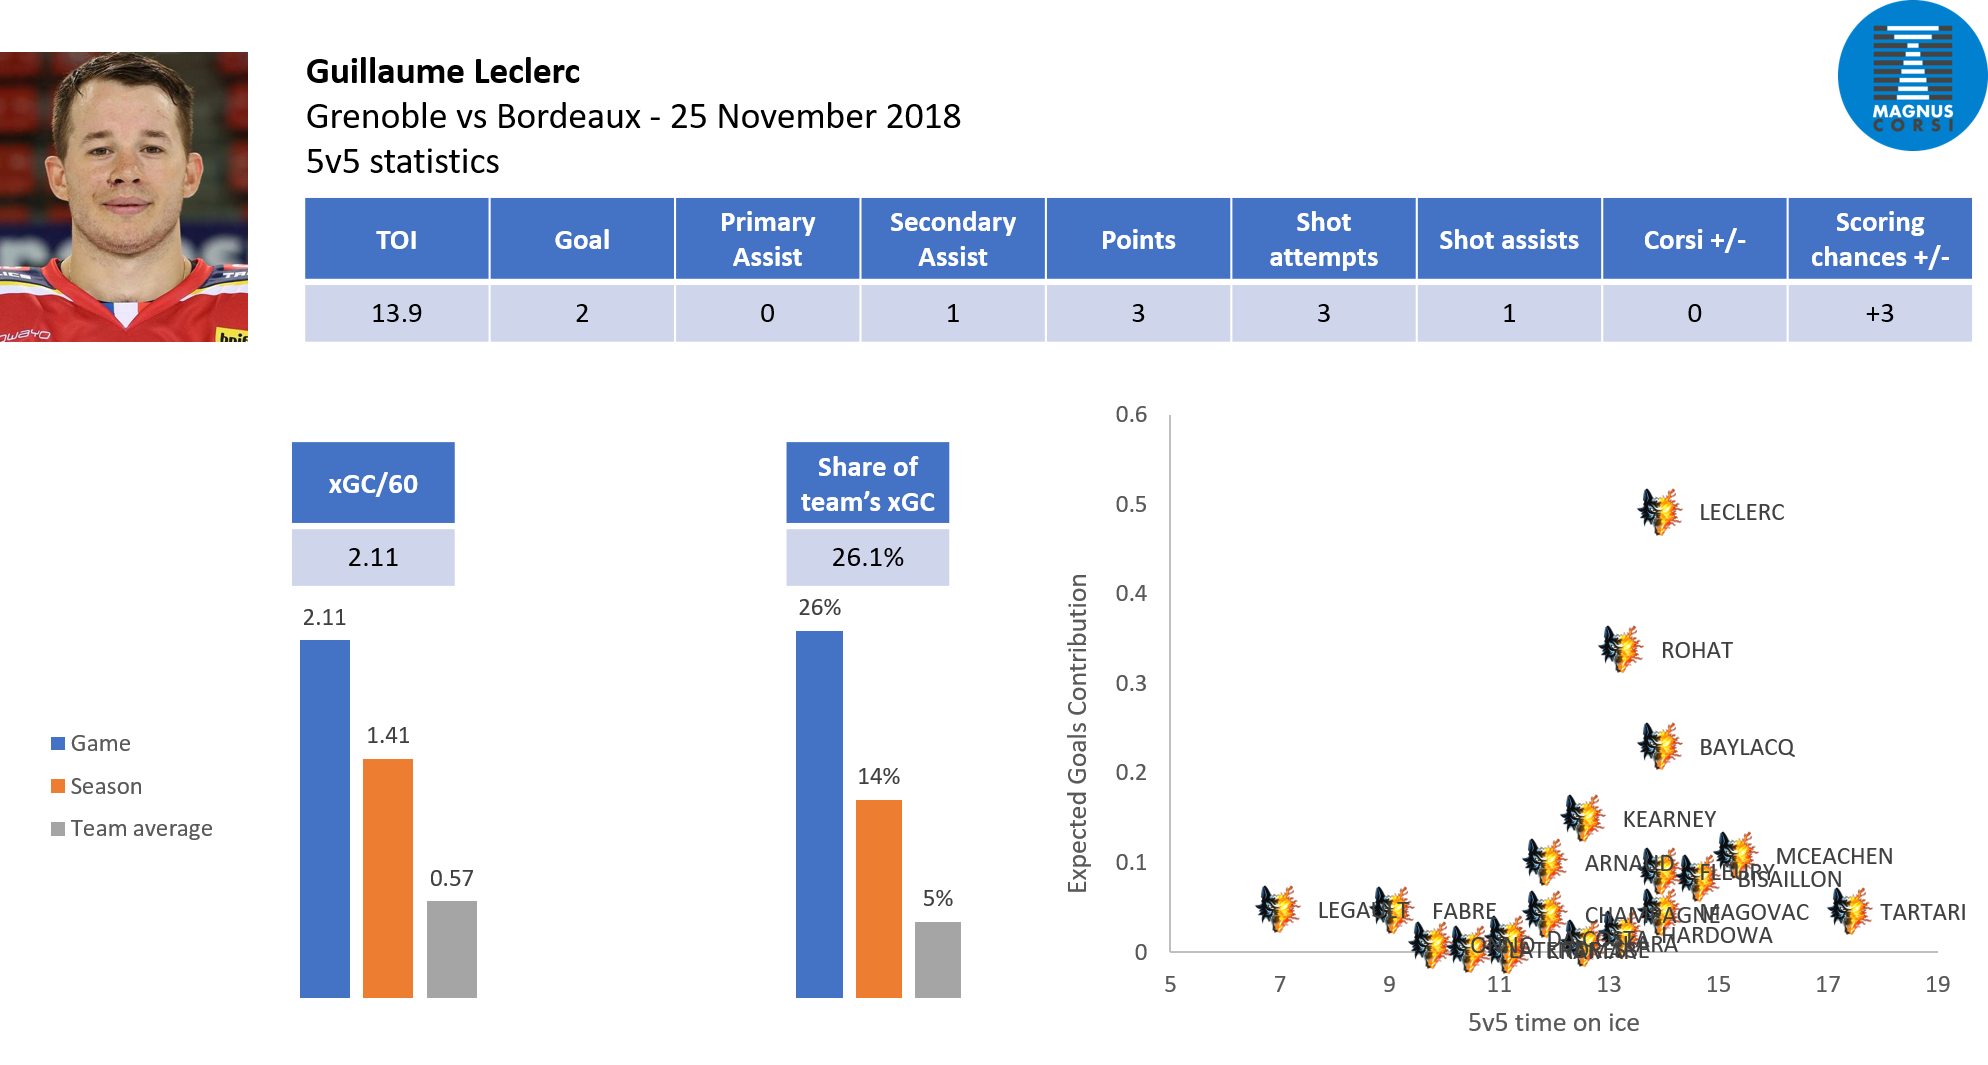
There are numerous ways we can use Expected Goals Contribution in our analysis. We can obviously look at the Expected Goals Contribution created by a player by 60 minutes over the season, and what share of the team’s total Expected Goals the player holds. A star player can hold close to 20% of her team’s Expected Goal Contribution when average players are around 4 to 5%.
Beyond that, we can look at how the Expected Goals Contribution is split for a player between each type of event compared to the league average, etc. How much of his Expected Goals Contribution come from Exits, Entries, etc.
Going back to the definition of events’ value and how often they lead to a shot, those metrics are also very important for players. How often does a pass exit from player X lead to a shot compared to his teammates or the league average? And how much value does it lead to on average?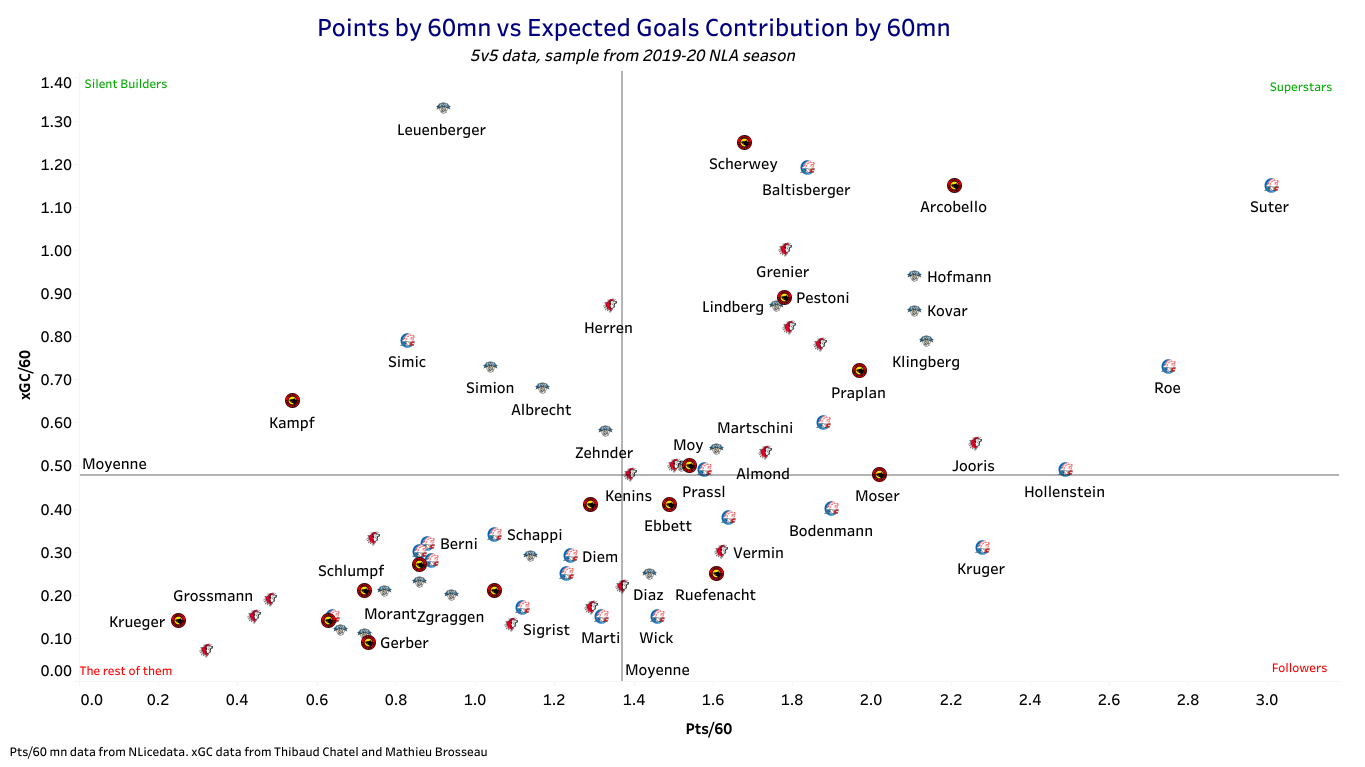
Here is a comparison of Expected Goals Contribution/60 and Points/60 at 5v5 for some NLA teams this year my colleague Mathieu Brosseau and I tracked for this research. Pius Sutter, Mark Arcobello and Gregory Hoffman were top players in the league, but the interesting ones are those who split from the natural line of correlation. At the top, Tristan Scherwey scored only 23 points over 44 games, but his Expected Goals Contribution by 60 in our sample is at the top. On the contrary, Markus Kruger recorded a high number of points/60, but his Expected Goals Contribution remained quite low. He is sitting in a quadrant I called “Followers”, but it could have been “Vampires”.
Including Expected Goals Contribution in a game summary for a player helps us further our analysis of that player’s performance (comparing a game versus total season average and the team average, etc). Here it shows how great Guillaume Leclerc’s performance was on November 25, 2018, even by his season’s standards. We could also have split his Expected Goals Contribution between events (exits, entries, passes, shots) and see if his role was the same as usual over the season.
Using Sequences for Scouting
Overall, Sequences and all the metrics they enable can be used to detect patterns and strengths in other teams, at a collective level (e.g. how teams are creating Sequences most often, using which types of exits, entries, etc.), and player by player.
Here, for example, we see that Sebastien Bisaillon, a defenseman from Grenoble, has a clear preference for exiting the puck with a pass and rarely tries to carry the puck out of the zone. However, when he does, the average Expected Goals created in the following Sequence are twice as much as when he does a pass exit: 0.022 xG vs 0.011 xG. Maybe he should do it more often.
He is also a master at dumping the puck to the right place, his exits in dump lead to a shot almost three times the league average (33% vs 13%), and create more than four times more Expected Goals than the league average (0.046 xG vs 0.010).
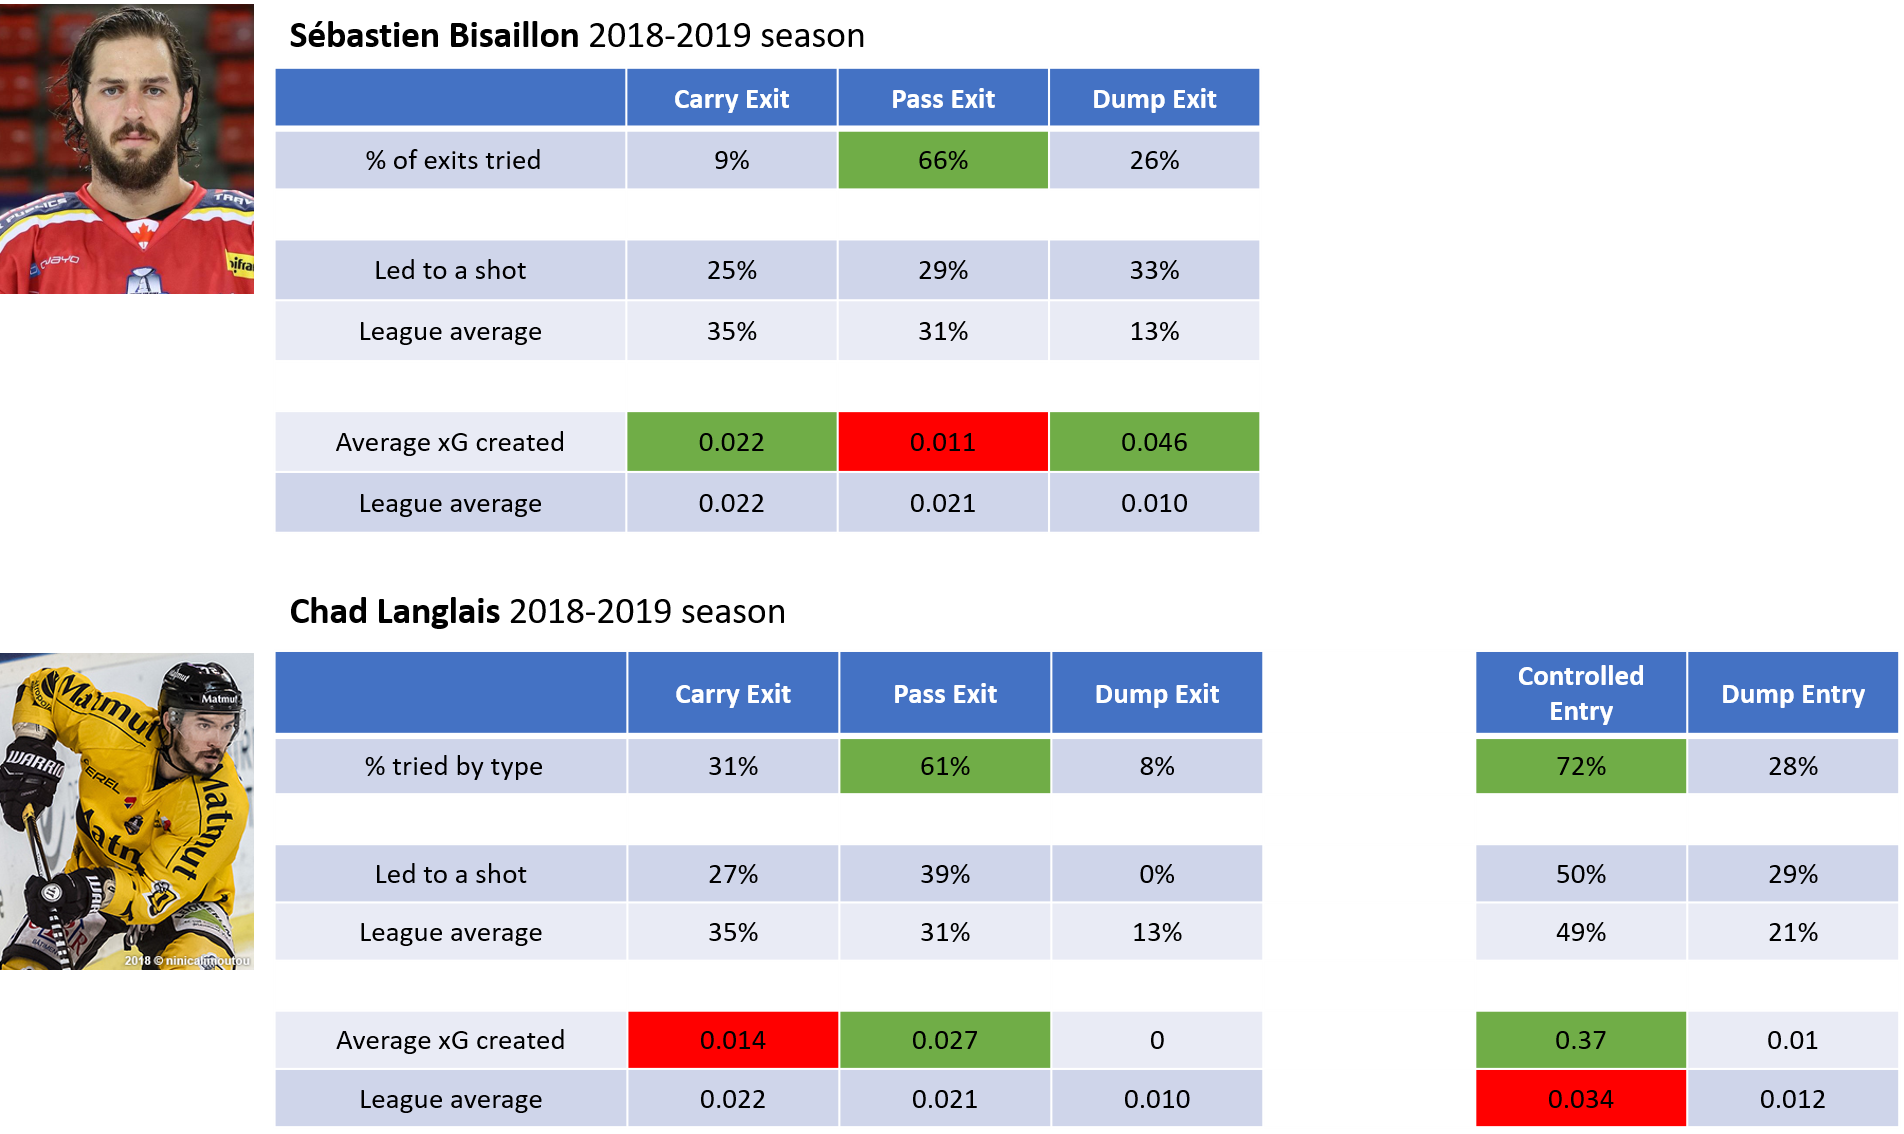
Chad Langlais, a defenseman from Rouen, also prefers using passes to exit the zone but, unlike Bisaillon, that is also when he creates the most danger, 0.027 xG in average versus 0.014 when carrying the puck, which is below league average.
However, his most impressive performances come through a controlled zone entry. Though his lead to a shot at the same rate than the league average (50% vs 49%), he creates an average 0.37 xG, almost ten times the league average!
Conclusion
The principle of dividing a game into Sequences enables multiple levels/areas of analysis, all related to the fact that Sequences allow us to follow the chain of events inside a game. This opens a door for measuring the most effective strategies and how players contribute value overall. The level of detail we can dive into is deep and depends on how big the sample of data is.
Whether one is looking for player analysis, scouting competition, or evaluating potential trades, I believe it allows for a better view of the game overall compared to what teams and players have had in the past. Having put it to use this past season, I can tell I was only able to scratch the surface of what it can do.
In the future, any addition to the list of events we include in Sequences would allow more analysis and improve the Expected Goals Contribution calculation. Faceoffs, takeaways, details on exits and entries, etc. Maybe the NHL puck tracking will allow that. Moreover, the very way I calculated Expected Goals Contribution could be revised in the future – methods can always be improved, and I’ll likely be looking for new methods as I keep working on this. But the principle will remain.

Hi,just curious about your analysis. On the post you mentioned “If a Sequence includes one or several shot attempts, its value is the sum of the Expected Goals of all those attempts.” My question is – wouldn’t the maximum possible sum be 1, no matter how many shot attempts there are. Once a goal is scored a new sequence would begin with a center ice face-off.
I am really interested in your post and just want to understand it well.
Thanks
Ron
Hi Ron, in theory yes, that could be an adjustment to be made. Though I’ve never seen a 5v5 sequence leading to more than 1 xG so far. A full Power play maybe but not at 5v5.