
In April 2017, Rob Vollman tweeted out what he called “rough and preliminary” translation factors for women’s hockey. At the time, I was playing around with counting stats from two years of NWHL and CWHL hockey, and wanted to develop as many tools and resources as I could to better understand the women’s game. Curious to know what the competitive landscape of post-collegiate hockey looked like in North America and elsewhere, I began to keep track of data with the intention of building on Rob’s translation factors.
The world of women’s hockey in North America has changed dramatically in the three years since Rob’s tweet. My initial plans went up in smoke when the CWHL suddenly folded after the 2018-19 season. As a result, I shifted my focus to developing NWHL equivalency factors – or NWHLe – for NCAA DI, NCAA DIII, and USports. Unfortunately, it quickly became apparent that the sample size of USports alumnae to play a significant number of games in the NWHL was too small to work with.
METHOD
In order to determine NWHLe for NCAA DI and NCAA DIII, I turned to the work of Gabriel Desjardins and Rob Vollman. The thought process behind their approach is straightforward: compare the relative performances of players from one league to another to determine the difficulty of each league. The most basic way of doing this is to compare the rate of production (Pts/GP) for skaters. By quantifying the difficulty of each league, we can then create translation factors that can help predict a player’s production, especially in the case of rookies and first-year players.
Fortunately, collegehockeyinc.com has a public database of counting stats that dates back to the 2012-13 season. Unfortunately, the competitive landscape of the NWHL has been all over the map in the league’s first five years. During that time, there have been two exoduses of national team players in 2017-18 because of the 2018 Winter Olympics in Pyeongchang and in 2019-20 in the wake of the formation of the Professional Women’s Hockey Players Association (PWHPA).
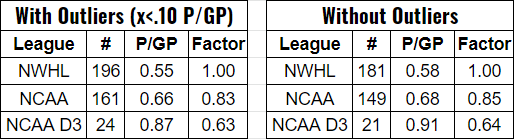
Another obstacle with the NWHL data I had to work with is that prior to the 2019-20 season, the regular season was 18 games or less – roughly half of an NCAA season. To get a better idea of what I could glean from the counting stats I had put together, I whittled down by database to exclude all players who played fewer than 12 games and compared their rate of production in the NWHL to their rate of production in NCAA DI and DIII hockey. To improve the results of this already problematic approach, I borrowed a leaf out of Ian Tulloch’s book and removed outliers (players below .10 Pts/GP).
After this cull, I was left with a sample size of 181 NWHL players, 170 of which had played either NCAA DI (149) or NCAA DIII (21) hockey. Unfortunately, only nine of those 181 played USports hockey, which effectively eliminated that data set from NWHLe.
Traditionally, determining equivalency between two leagues exclusively takes into consideration a skater’s relative production in consecutive seasons. This is especially useful when trying to project the production and impact of rookie skaters as they move up the ladder to a more competitive setting.
Applying this methodology to the last two NWHL rookie classes of NCAA DI seniors produced interesting results. I classified all players who were under 25 on Oct. 1 in their first season of NWHL hockey as rookies to include players who missed a year(s) due to injury, hiatus, play in Europe, and/or residency with a national team.
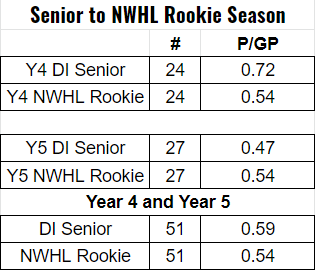
A comparison of the rates of production of the 2018-19 rookie class to the 2019-20 class speaks volumes about how much change the league has undergone – although it should be noted that a 24-game season could have had some influence.
It also reinforces that after five years of NWHL hockey, we still don’t have enough data to work with to build reliable translation factors or to quantify the difference between NWHL, NCAA DI, and NCAA DIII hockey. With that being said, we do have some building blocks that can point us in the right direction.
WEAKNESSES
First and foremost, even after waiting a few years to work with these numbers, the sample size leaves much to be desired in both quality and quantity.
There are ways to improve the quality of the data in this study by including factors like the relative strength of college conferences, separating the data of forwards and defenders (and players who play both), and incorporating even strength production. However, many of these filters shrink the data pool we’re working with and none of them address the quandary that is the NWHL’s ever-changing level of competition.
This is an issue that Alyssa Longmuir first examined for The Ice Garden following the 2017-18 season. Since her look into the impact of national team players leaving the league, we saw (some of) them return in 2018-19 followed by a second exodus ahead of the 2019-20 season. The level of hockey was still high, but it has been all over the map since the league’s inaugural season in 2015-16.
Even though translation factors are an imperfect science for predicting performance, these NWHLe factors should be seen only as guidelines. They are lighthouses; cardinal directions. It stands to reason that production in NCAA DIII hockey means less than production in NCAA DI when we attempt to project or predict what a player’s performance in post-collegiate hockey in North America might look like.
Given all of the pitfalls and asterisks that presented themselves in this project, a lighthouse pointing us in the right direction still feels like a step in the right direction even if it is anticlimactic.
NEXT STEPS
While we wait for more NWHL hockey to be played and data to be compiled, there is work to be done elsewhere in equivalency with women’s hockey data.
We can refine the methodology of NWHLe by incorporating even strength production and factoring in the strength of conferences in NCAA DI and DIII hockey. Furthermore, we can expand NWHL equivalency to include leagues like the Swedish Women’s Hockey League (SDHL) and Zhenskaya Hockey League (ZhHL) in Russia.
There is much to be gained by looking at women’s leagues in Europe, especially the SDHL. The SDHL is home to the bulk of the top European players in the world (excluding Russian-born players) and many of the league’s top players developed in NCAA DI programs. This is a particularly appealing approach because of the dearth of coverage of women’s hockey by North American media. There is only so much we can learn from annual international tournaments with half a dozen games and group formats that skew data for both individuals and teams.
The NWHL’s expansion into Toronto for its sixth season could also result in a substantial growth of USports athletes. In turn, this could add insight into comparisons between collegiate women’s hockey north and south of the border. As is the case with all things women’s hockey, the more numbers we have to work with, the better.
It is all too easy to be overwhelmed and disheartened when working with women’s hockey data. The end result of countless hours of work and research rarely lives up to even the most pragmatic of expectations because of the limitations and obstacles that have come to define this sect of hockey analytics. Needless to say, I wanted more out of this multi-year project. I wanted translation factors that were essentially bulletproof, but we aren’t there yet. And that’s okay.
