
When people ask me how to get into sports analytics, I always suggest starting with a question that they’re interested in exploring and using that question as a framework for learning the domain knowledge and the technical skills they need. I feel comfortable giving this advice because it’s exactly how I got into hockey analytics: I was curious about goalie pulling, and I couldn’t find enough data to satisfy my curiosity. There are plenty of articles on when teams should pull their goalies, but aside from a 2015 article on FiveThirtyEight by Michael Lopez and Noah Davis, I couldn’t find much data on when NHL teams were actually pulling their goalies and if game trends were catching up to the mathematical recommendations. I presented some data on the topic at the Seattle Hockey Analytics Conference in March 2019, but the following analysis is broader and includes more seasons of data.
Data collection notes
- All raw play-by-play data is courtesy of Evolving-Hockey and their scraper.
- Data includes all regular season games from 2013-14 onward. All 2019-20 data is up until the season pause, through March 11, 2020.
- Only the first goalie pull per team in each game is counted for the average times. For example, if a team pulled their goalie while trailing by two and then later in the game pulled their goalie again while trailing by one, only the first instance is included in the average times. All extra attacker time is counted for the scoring rates.
- More details on this data set, particularly at the team level, is available here.
When do goalies get pulled?
In hockey, teams pull their goalie in favor of an extra skater when they’re trailing late in a game. This strategy is used almost universally in the NHL: from the 2013-14 season through 2019-20, of all game situations in which one team was trailing within the last two minutes, there was a goalie pull in 98% of those games. The other 2% of those games almost always involved a very late goal (e.g., the game was tied until the last 10 seconds, so there was no real opportunity for a goalie pull) or the trailing team drawing a penalty.
(Teams often pull their goalies on delayed penalties, as well, but since there is no risk involved in that strategy—the whistle blows as soon as the other team touches the puck—they aren’t appropriate to be included here. Most similar analysis simply looks at the last two or three minutes of game play in order to avoid this problem, but here, to have a more robust data set that strived to include each legitimate goalie pull, delayed penalty situations were identified and removed.)

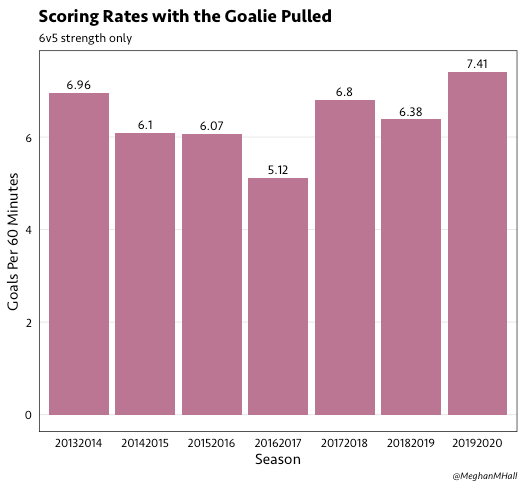
The usage of the strategy is not debated because as shown in the graph above, there is a measurable goal scoring advantage in having six skaters on the ice against five. Unsurprisingly, the goal scoring rate is similar to a 5v4 power play. Instead, the debate around goalie pulling comes around when to pull the goalie. More time at 6v5 gives a bigger chance of scoring a goal, but as the bar on the far right shows, the goal scoring rate against an empty net is particularly high.
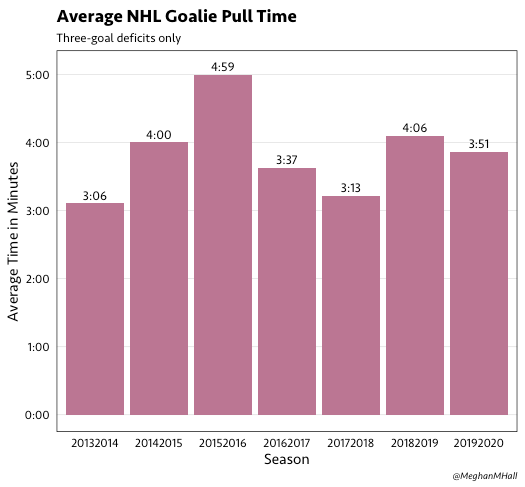

Teams tend to pull their goalie earlier when they’re down by more goals. The averages when down by three goals tend to vary across seasons, most likely because these are long-shot scenarios with little chance of success. As for the spike in 2015-16: Colorado Avalanche coach Patrick Roy often gets the credit for the particularly aggressive goalie pulls during that season, but the Tampa Bay Lightning and the Chicago Blackhawks did so, as well. For two-goal deficits, teams haven’t become particularly more aggressive in recent seasons.

If we only look at games with a one-goal deficit (as those are the games that are most likely to end in a successful outcome for the trailing team), we can see that the average pull time has creeped up about 30 seconds over the past seven seasons.
If late goals—games that are tied until the last minute, allowing for less of an opportunity for the trailing team to pull their goalie—are removed, then the average pull time increases by an additional two seconds per season, on average.
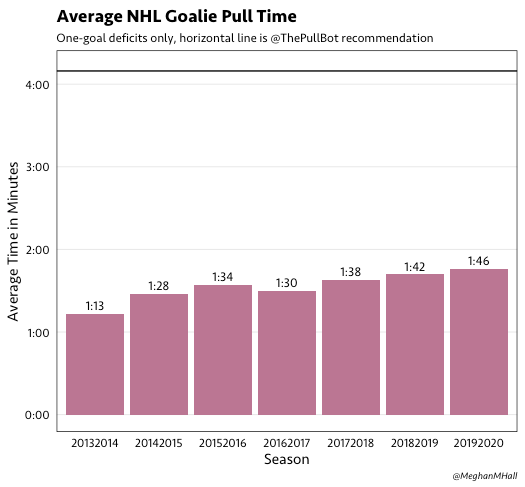
Thirty seconds over seven seasons might seem like an improvement, but compared to the models mentioned earlier on when teams should pull their goalie to maximize possible standings points, there is quite a lot of progress left to be made. The horizontal line in the graph above represents the average recommendation, when down by one goal, by ThePullBot, which was developed by Moneypuck and is based on the Beaudoin and Swartz paper linked above.
Which teams are more aggressive?

There is certainly variation by team, as well. Teams like the Toronto Maple Leafs and the Carolina Hurricanes have been consistently more aggressive than average over the past few seasons. More details on team-level data is available here.
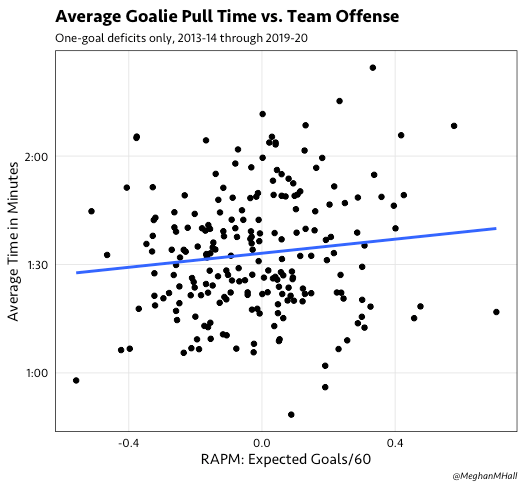
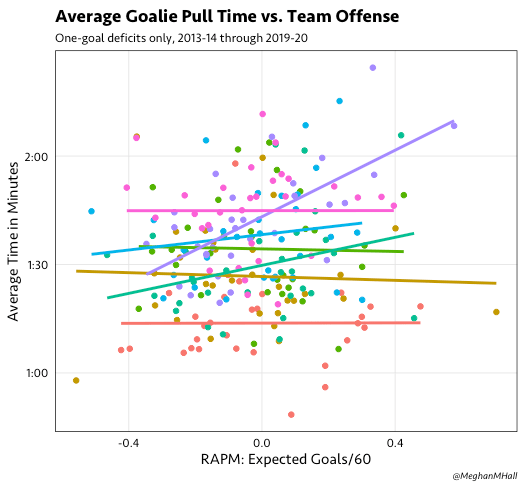
Besides knowing which individual teams are more aggressive, we can investigate to see if there might be any common characteristics among those aggressive teams. First, by looking at a measure of team offense, we can start to address the question of whether a more offensively-skilled team tends to pull their goalie sooner. The metric used below is the expected goals per 60 RAPM metric from Evolving Hockey, and we can see that there isn’t a particularly strong relationship between the strength of a team’s offense and the average time that they pull their goalie. (The second graph is the same as the first, just with individual seasons identified so it’s clear there isn’t much of a relationship in any one season.)
We can also look at this with a slightly more nuanced view. Instead of using team offense as the comparison measure, we can instead look at just the forwards who are on the ice when the goalie is pulled (as teams tend to use their best forwards in the extra attacker situation) and create a weighted value of their offensive ability, using a similar even-strength RAPM metric as a proxy. However, as shown in the graph below, there isn’t evidence for a strong relationship between how aggressive teams are in pulling their goalie and the offensive strength of the forwards who play in that situation.

Does this actually work?

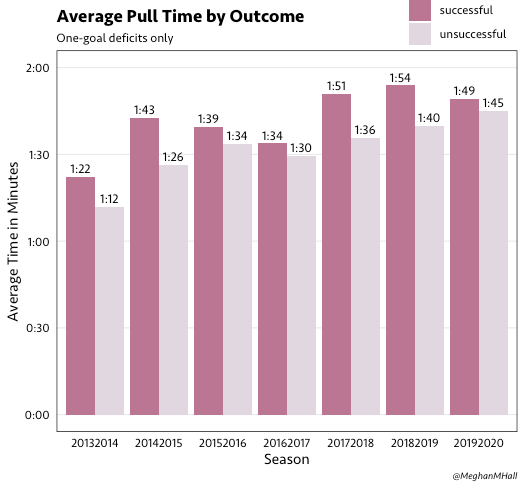
In this context, success is defined as the trailing team either winning the game in regulation or more commonly, tying the game to send it to overtime after pulling their goalie. Among games with a one-goal deficit, the success rate has been around 15 percent for the past few seasons. Successful outcomes when the trailing team is down by two goals are more rare: about one percent overall, or 25 total times over these seven seasons. There have been no successful outcomes when the pulling team was down by three goals.
We can also see below that successful outcomes tend to start with a slightly more aggressive goalie pull.
Who’s on the ice?

On the 5v4 power play, the use of four forwards as opposed to three has increased in popularity over recent years, and the same trend favoring forwards has appeared during 6v5 time, as well. (More details on which teams use which players at 6v5 is available here.) The use of five forwards with the net empty has nearly doubled over the past seven seasons, but the graph below of the 6v5 scoring rates over time doesn’t show such a neat increase.
Are there changes during the season?
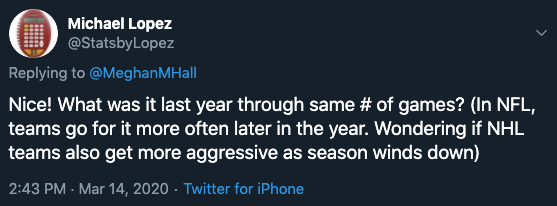
When I posted the last batch of goalie pulling data for the 2019-20 season, Michael Lopez asked the above question about whether there are in-season changes.

I looked at this question from two angles. First, as shown above, is there a measurable change by month during the season (i.e., do teams get more aggressive as the season goes on)? It appears not. I also looked at this split by season, but there was no measurable change in this trend in recent years.
Also, as shown below, I looked at the average pull time (one-goal deficits only) based on playoff status. I defined a “chasing” team as one that was within two points of a playoff spot, and if we look at the data from December onward, it doesn’t appear that chasing teams were more aggressive in pulling their goalie. (The spike in 2014-15 is mostly due to the Nashville Predators, who were fairly aggressive that year and spent a good amount of time chasing a playoff spot.)

What about 6v4 time?
In 2018, Matt Cane wrote an article for this site on whether teams should be pulling their goalies on the power play. It’s easy to see why: if you refer to the scoring rates graph at the beginning of this article, you can see that 6v4 play over these seven seasons leads to nearly 12 goals per 60 minutes, compared to just shy of 6.5 goals per 60 minutes for 6v5 time. Teams playing at 6v4 also give up empty net goals at a lower rate, just under 11 goals per 60 minutes, than at 6v5.

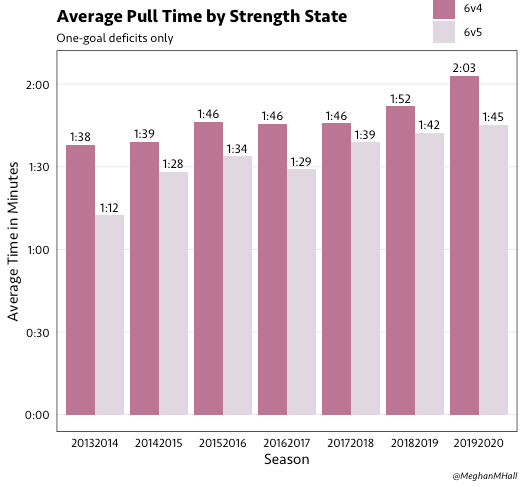
The graph above shows the percentage of all goalie pull time, by score difference, that is played at 6v4. It doesn’t appear that teams are spending much more time at 6v4 recently, though we can see below that teams tend to pull their goalie earlier in situations that start at 6v4 as opposed to 6v5.
What about venue and opponent?
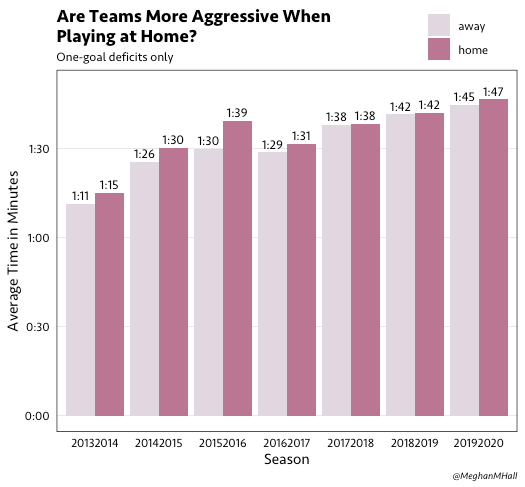
Home teams tend to generate more shot attempts than teams playing on the road, so it’s a logical question as to whether teams pull their goalies sooner when playing at home. As shown above, they do, however the difference is consistent yet on average, very small.
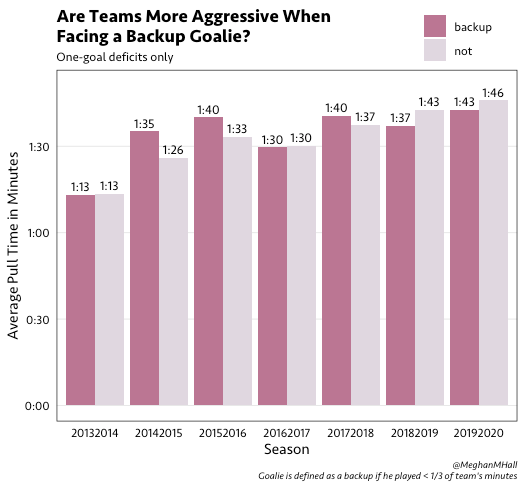
Another logical question involves the opponent: are teams more aggressive in pulling their goalie when they’re facing a backup goalie? A backup goalie was defined as one who played less than one-third of his team’s minutes that year, and as shown below, it appears that there’s not much of a difference.
What happens during playoffs?
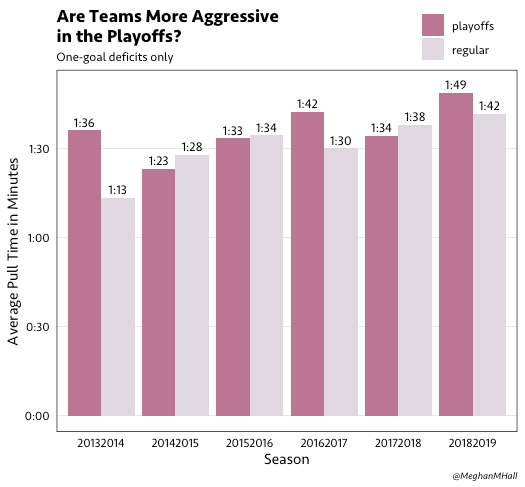
As shown in the graph above, there isn’t a sustained difference in the average pull time when comparing playoff games to those in the regular season. Most of the large differences can be explained by a particularly aggressive team during a playoff run (e.g., Colorado in 2013-14).
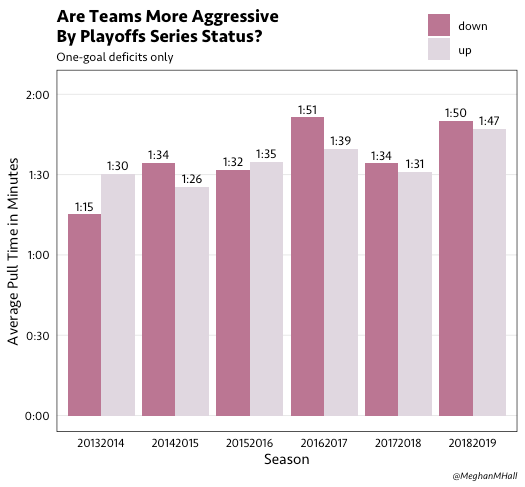
We can also investigate within-playoff differences to see if teams that are trailing in a playoff series are more aggressive than teams that are leading the series. There is a slight trend toward more aggressive play in recent seasons for trailing teams, but it isn’t particularly dramatic.
Further questions
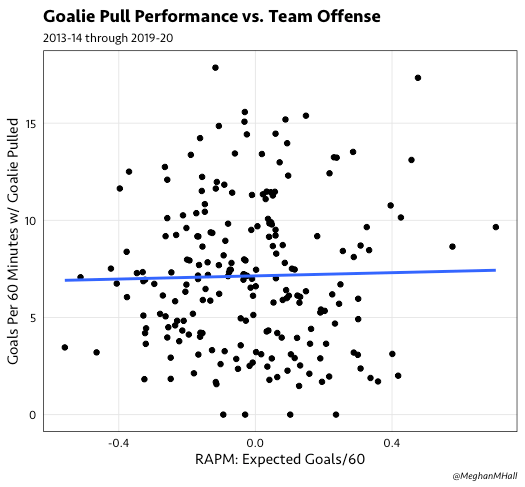
Many of the questions left to examine in this area are about individual team performance: which teams perform particularly well with the extra attacker and why? However, since teams do not spend a large amount of time with their goalie pulled (an average of just 34 total minutes per season), it’s difficult to draw conclusions from such limited TOI.
As an example, the graph below shows the lack of relationship between team offense (the RAPM metric referenced earlier) and goal scoring rate with the extra attacker.
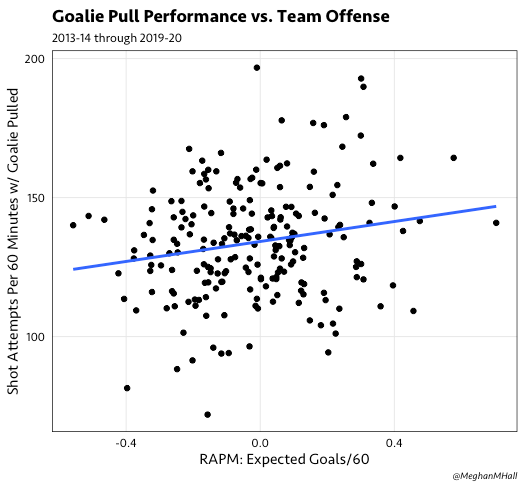
If we change the y-axis to the shot attempt rate instead, the relationship becomes a little bit more clear.
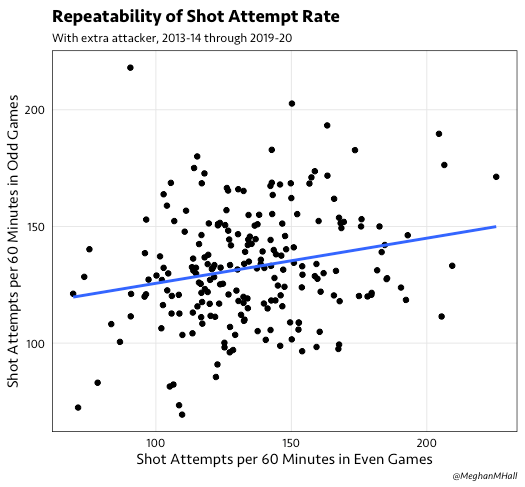
Similarly, the repeatability of scoring goals with the extra attacker (i.e., comparing the goal scoring rate in even games versus odd games for a given team in a given season to examine whether it’s a repeatable skill) is nearly zero. However, as shown below, this correlation between odd games and even games for the shot attempt rate, as opposed to the goal scoring rate, is closer to significant, at 0.22. Replicating this exercise (dividing each team-season into two groups and comparing the rates) 1000 times gives a correlation of 0.19.
Further work in this area can examine how extra attacker performance (whether through goals or shot attempts) correlates to team performance at even strength.

This was a terribly interesting read. Thanks for crunching all those numbers.
Extremely useful data. We will reference it in our new Markov Decision Process text.
If the chance of an empty net goal being scored is 19% at 6-5, then doesn’t that more than cancel out the increase to 6% of scoring a goal with the extra player on the ice?
You have to compare it to the chance of scoring a goal in the final minutes of the game. It’s hard to compare, since teams pretty much always pull the goalie in the last minutes when trailing.
But on average teams have a 3.75% chance to score a goal each minute on 5v5. That’s a roughly 5.6% chance to get the goal. Compared to the 15% success rate of pulling the goalie, we can estimate that you’re nearly 3x more likely to tie the game by pulling the goalie.
Basically if the losing team scores a goal, it changes the outcome. If the winning team scores a goal, its the same outcome.
Pulling the goalie with over 2.5 minutes left is dumb and 97% of the time the Opposing team scores. They also look stupid 200% of the time. These are just rough stats
it all looks good on Paper ,but the year I now have been watching and loving Hockey I have yet to see it work