The 2017 NHL GM Report Card – Part 3

It’s been a crazy couple of days writing up this general manager project. If you haven’t already, please read the methodology before checking out our final list of rankings.

When going through the final rankings there were several interesting things that only show up when the data is viewed holistically. Here are some of our big findings that didn’t make it into the rankings piece.

GM Ranking

Continue reading

The 2017 NHL GM Report Card – Part 2

(This piece was written as a collaboration between Carolyn Wilke and Chris Watkins)

Alright, we’re only a little bit sorry we made you read our methodology post first, because we know what you really want is below. Still, we recommend you understand how we came to our ratings before you continue reading this post.

We’re sure you’ll disagree with us on some points, and that’s fine – despite our best efforts, these are still fairly subjective ranks. Still, try this exercise for yourself, and it’s possible your opinions will change.

Now, without further ado – all 31 GMs, ranked.

Continue reading

The 2017 NHL GM Report Card – Part 1

(This piece was written as a collaboration between Carolyn Wilke and Chris Watkins)

What makes a good general manager in the NHL?

It’s a hard question, plagued by subjectivity, by bias, and by lack of transparency. It’s complicated by league mandates like the expansion draft and the hard salary cap. It mixes the weight of process, results, and vision into one big stew, where it can be difficult to distinguish the meat from the sauce.

It’s a question, that unlike many others, is difficult to quantify with even the most advanced of stats.

And it’s one that the league has no desire to answer definitively, as that would only hurt the men currently in those roles.

Fortunately for you, Hockey Graphs loves tackling the hard questions.

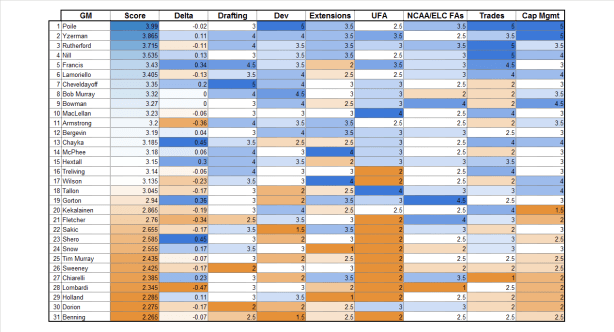
In the following articles, we will attempt to rank all 31 of the NHL’s GMs, as objectively as possible, according to seven important criteria. They each painstakingly researched trade histories, draft selections, and salary cap management, coming up with a final score for each.

While this process still was subjective, in that these scores are not quantitatively derived, it was an extremely holistic process, and both of us were forced to confront some of our own biases.

Continue reading

How Indicative are hits in the 2017 Stanley Cup Playoffs: Quarter-finals

As the Stanley Cup Playoffs progress, the intensity rises. This often leads to more physical play, thus an increase of hits. Hockey traditionalists, including players and coaches, have often pointed to increased hits as a part of playoff hockey. Some teams have altered their strategy to embody a more physical style, simply because it is the playoffs.

The impact of hitting has been explored before during the 2014-15 season, the 2015 playoffs (both by Garret Hohl), and the 2016 playoffs (by @yolo_pinyato). However, none found a decisive correlating success to hits.

Continue reading

FQG: Using Goals Above Replacement to Measure Injury Impact

Embed from Getty Images


Injuries are an inevitable part of the NHL. An 82 game schedule guarantees that all teams are going to deal with injuries during the season but not all teams deal with them equally. Quantifying the impact of injuries is difficult. The introduction of better individual player impact stats gives us some new tools with which to approach this concept. In particular, DTMAboutHeart‘s Goals Above Replacement stat seems a useful place to start because it allows for estimating how many goals above replacement a team loses while a player is injured.

All injury data in this post comes from NHL Injury Viz. GAR data comes via DTMAboutHeart. Games played data comes from Corsica and standings data is via Hockey-Reference.

Continue reading

Measuring Playoff Excitement

Most of us are by now familiar with the concept of win probability. The current state of the game has many implications on the way the game is played and I’ve been a proponent of using it to adjust statistics as an alternative to using just the score, since win probability itself is simply a function of score and time remaining.

In the spirit of the playoffs today I want to use win probability and corresponding statistic leverage to measure ‘excitement’. Leverage is the total win probability added (and for the opposing team, lost) on account of a particular goal. If a team scores a goal in the last second of the third period, the win probability added would be about 0.5: they went from essentially 0% to 50% chance of winning the game.

Continue reading

Behind the Numbers: Scientific Progress and Diminishing Returns in Hockey Statistics

Embed from Getty Images

Every once-in-a-while I will rant on the concepts and ideas behind what numbers suggest in a series called Behind the Numbers, as a tip of the hat to the website that brought me into hockey analytics: Behind the Net.

As the hockey analytics community pushes for validation of current metrics and their value, I think it is sometimes lost that we do understand these statistics have their weaknesses. We do wish and try to improve upon these weaknesses.

I also think an often underlooked fact is that each incremental improvement diminishes the potential value from every subsequent improvement.

Let’s take a look at what I mean…

Continue reading

A New Look at Aging Curves for NHL Skaters (part 2)

In part 1 of this series, I looked at how NHL skaters age using the delta method with Dawson Sprigings’ WAR model. As mentioned in my previous article, there is still one major problem with the delta method that needs to be addressed: survivorship bias. The “raw” charts presented in part 1 are quite informative, but they’re missing a correction for this bias. Before we can draw conclusions about what this new WAR metric tells us about NHL skater aging, we need to figure out how to correct for survivorship bias.

Continue reading

Identifying Playing Styles with Clustering

One of the aspects of player performance that is discussed ad nauseam is chemistry. How well do certain players elevate their performance with one player or another due to some inherent ability to find the other on the ice? To know what a teammate is going to do? However, very little has been done to analyze this phenomenon. In this piece, I posit that by identifying playing styles, something that’s been done in the NBA, we can quantify how well certain players will complement one another.

All data is from 5v5 situations from the 2015 – 2016 and current season, totaling almost 900 games from the Passing Project volunteers and Corey Sznajder. Special thanks to Asmae for her guidance throughout this piece.

I want to stress that this is a first foray into this type of analysis and simply because a player has a different style than what I’ve named (which are relatively arbitrary) it doesn’t mean they are necessarily better than another player. Players may have similar styles, but some will simply be more effective due to their ability. Finally, given that each day we accumulate more data, a player with a smaller sample size could find themselves in a different cluster in future analysis.

Continue reading

A Defense of WAR from a WAR-Skeptic

Embed from Getty Images

Note: This was originally intended to be a tweet-thread which grew far too long and unmanageable, so you’re getting a poorly-written post instead. Apologies in advance.

Recently, David Johnson, owner of the awesome puckalytics.com has been on a bit of a warpath (pun intended) against the use of WAR/GAR. Most of David’s arguments can be found here and here, but there are some other comments in this thread.

I consider myself a bit of a WAR skeptic. I think Dawson’s work is great, but I think there are limitations/issues with it. A good summary of some of my concerns can be found in another ill-advised and long tweet thread.

With that being said though, I still think it’s extremely useful as a first pass to start discussion. WAR can be broken down into 5 useful components to see where a players impact derives from.

Continue reading